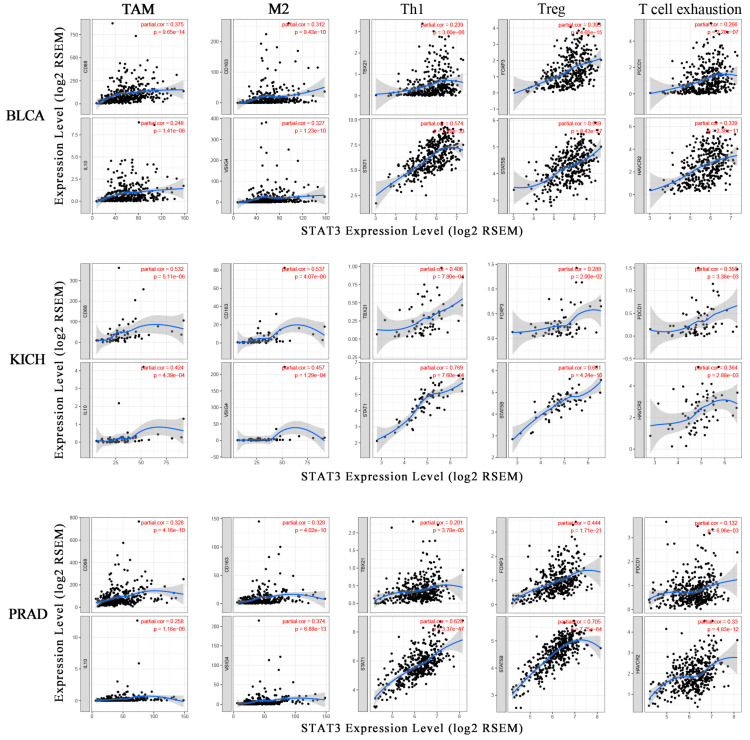
Figure 4.
The correlation between STAT3 and marker genes of immune cells. The scatter plots showed the correlation between the STAT3 expression level and the gene markers of TAM (CD86, IL10); M2 macrophages (CD163, VSIG4); Th1 (TBX21, STAT1); Treg (FOXP3, STAT5B); T-cell exhaustion (PDCD1, HAVCR2) expression levels in BLCA, KICH, and PRAD.

