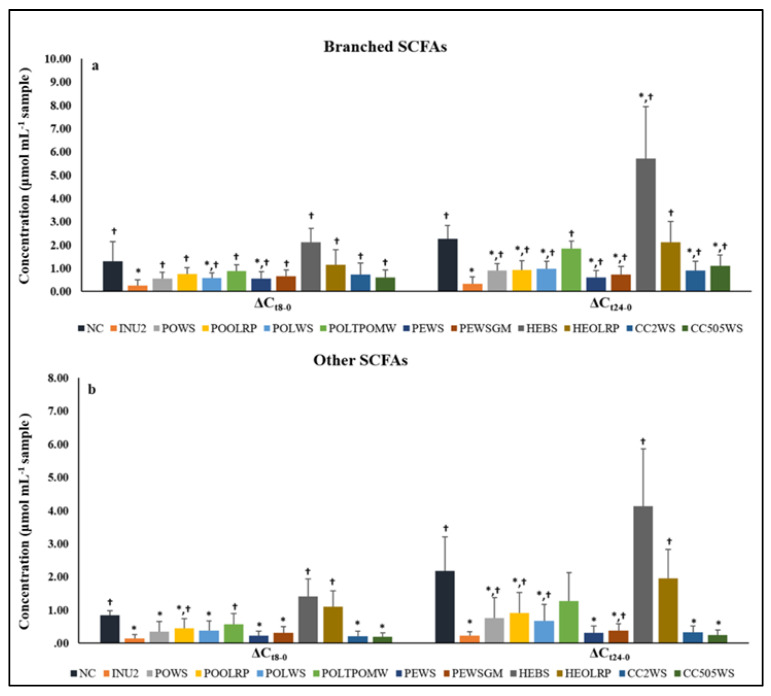
Figure 3.
Differences (Δ) in concentrations (μmol mL−1) of (a) branched SCFAs (BSFAs) and (b) other SCFAs after 8-h fermentation (ΔCt8-0) and 24-h fermentation (ΔCt24-0) compared to baseline. Values are expressed as mean and SD, where ΔCt8-0 is defined as ‘Concentration t = 8 h minus Concentration t = 0 h’ and ΔCt24-0 is defined as ‘Concentration t = 24 h minus Concentration t = 0 h’ (for POLTPOMW and HEBS n = 4 - for CC2WS and CC505 n = 7); *: significant difference compared to NC (p < 0.05) (Mann-Whitney test or t-test); †: significant difference compared to INU2 (p < 0.05) (Mann-Whitney test or t-test).

