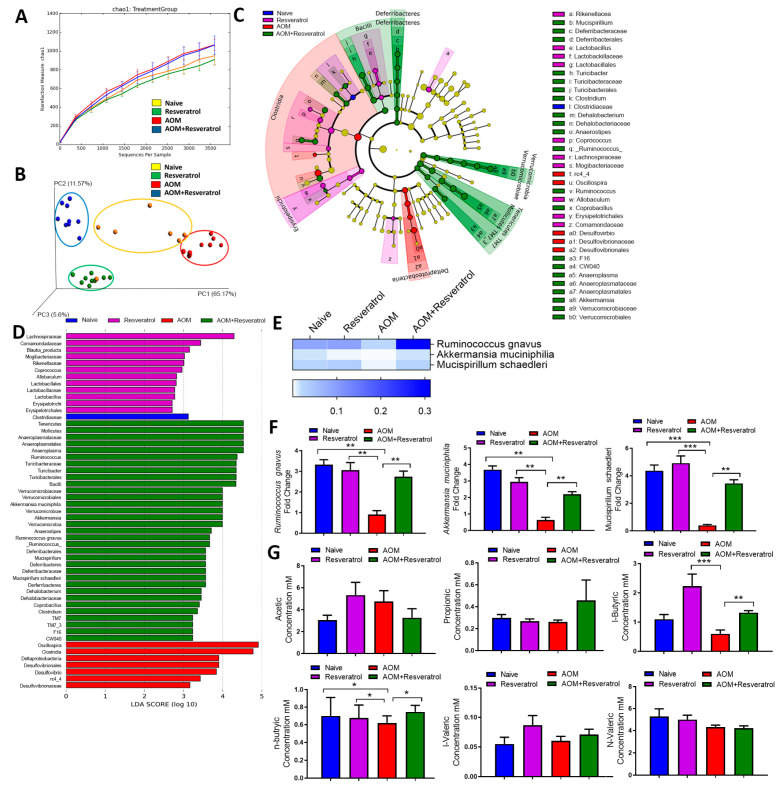
Figure 2.
16S rRNA sequencing analysis during AOM-induced CRC treated with resveratrol. The study was designed as described in Figure 1 legend. Gut microbiome samples were collected from experimental groups by performing colonic flushes in experimental groups, which were the following: Naïve (n = 7), Resveratrol (n = 9), AOM (n = 10), and AOM+Resveratrol (n = 9). Nephele analysis (nephele.niaid.nih.gov) was used to generate charts for chao1 alpha diversity (A) and PCA beta diversity (B). LeFSe analysis of the Nephele OTU output files generated the cladogram (C) and LDA score bar graph (D). (E) Heatmap and legend depicting mean OTU percent abundances of significantly altered species Ruminococcus gnavus, Akkermansia muciniphila, and Mucispirillum schaedleri. Rows represent bacterial species and columns represent the mean OTU percentages of experimental groups with SEM. (F) PCR validation of Ruminococcus gnavus, Akkermansia muciniphila, and Mucispirillum schaedleri. (G) Bar graphs representing concentration of SCFAs acetic acid, propionic acid, i-butyric acid, n-butyric acid, i-valeric acid, and n-valeric acid. Significance (p-value: * p < 0.05, ** p < 0.01, *** p < 0.005) was determined by using one-way ANOVA followed by Tukey’s post-hoc multiple comparisons test for depicted bar graphs. Experiments are representative of 3 independent experiments.

