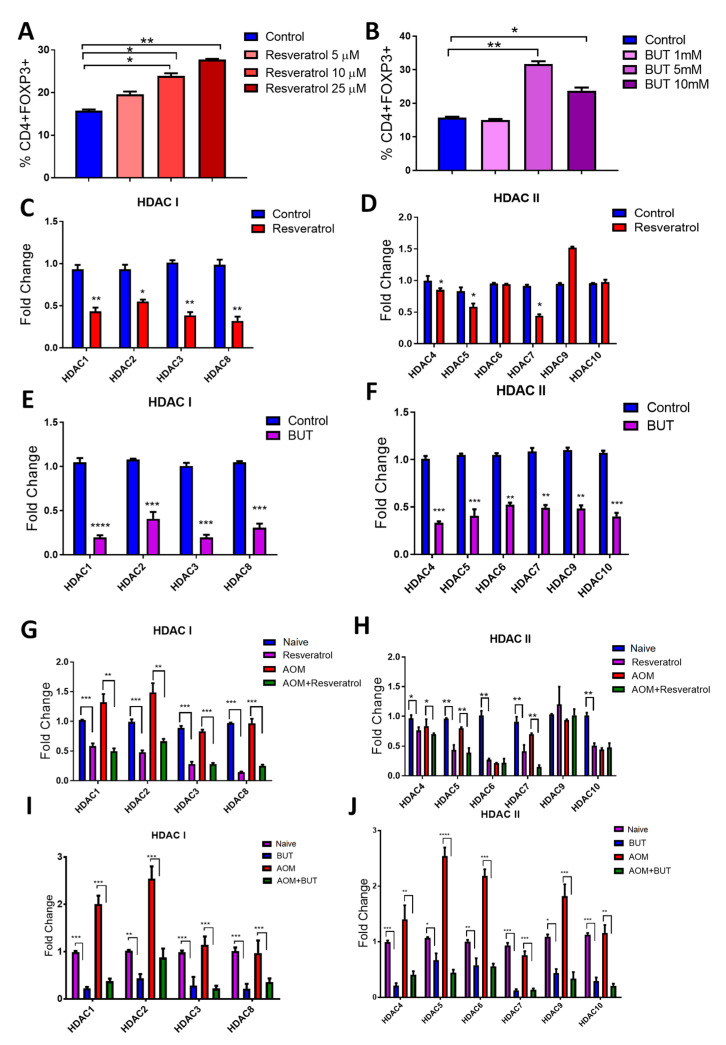
Figure 6.
Treatment with Resveratrol and BUT leads to HDAC suppression. Whole splenocytes (seeded at 1 × 10⁶ cells/mL) from 8–10 week old C57BL/6 mice were activated using CD3 (0.5µg/mL) and CD28 (2 µg/mL) in the absence or presence of appropriate vehicle control, resveratrol (5, 10, or 25 µM), or BUT (1, 5, or 10 mM). Tregs were identified by flow cytometry as represented in Figure S17. (A) Treg percentages after treatment with various doses of resveratrol. (B) Treg percentages after treatment with varying doses of BUT. Fold change expression as assessed by PCR for HDAC I (C) and HDAC II (D) after treatment with resveratrol (25 µM). Fold change expression as assessed by PCR for HDAC I (E) and HDAC II (F) after treatment with BUT (5 mM). Expression of HDAC I (G) and HDAC II (H) was evaluated from MLNs isolated from experimental groups (Naive, Resveratrol, AOM, and AOM+Resveratrol). Expression of HDAC I (I) and HDAC II (J) was evaluated from MLNs isolated from experimental groups (Naive, BUT, AOM, and AOM+BUT). For in vitro experiments, each group consisted of 3 wells (n = 3), and the data are representative of 2 independent experiments. For in vivo experiments, each group consisted of 5 mice (n = 5), and the data is representative of at least 3 independent experiments. Significance (p-value: * p < 0.05, ** p < 0.01, *** p < 0.005, **** p < 0.001) was determined by using one-way ANOVA followed by Tukey’s post-hoc multiple comparisons test for depicted bar graphs.

