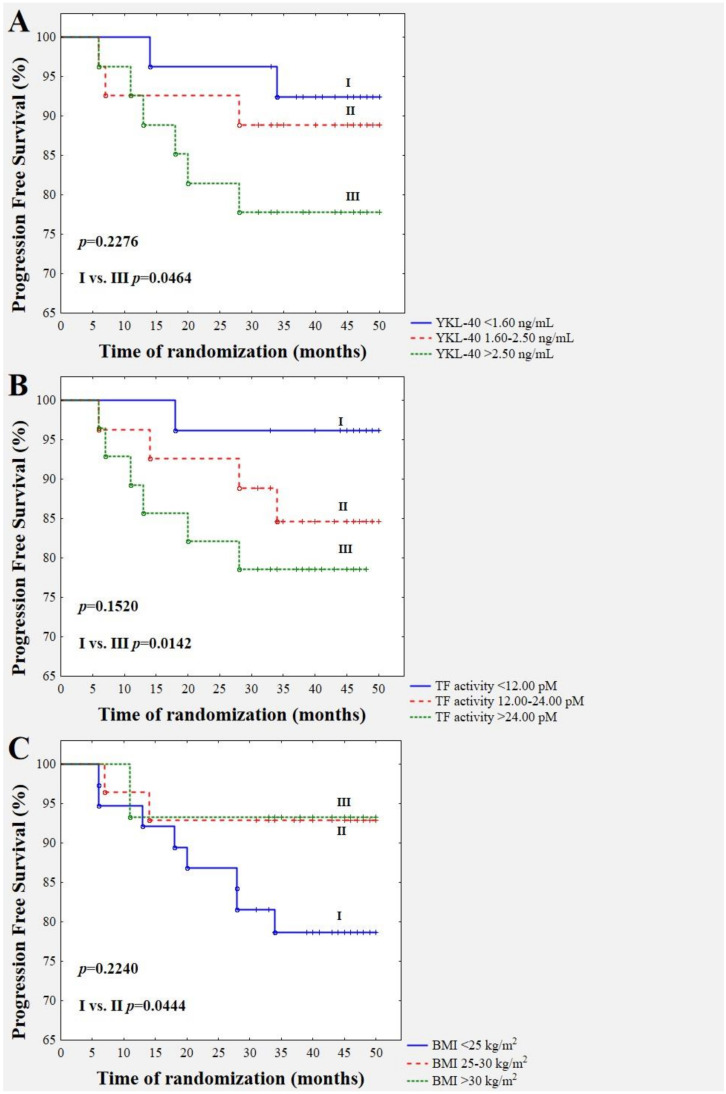
Figure 2.
Kaplan–Meier survival curves showing baseline serum YKL-40 (A), TF activity (B), and BMI (C), divided according to cut-offs for YKL-40: < 1.6 ng/mL, 1.6–2.5 ng/mL, and >2.5 ng/mL; TF activity: <12 pM, 12–24 pM, and >24 pM; and BMI value: <24.9 kg/m2, 25–29.9 kg/m2, and >30 kg/m2, respectively.

