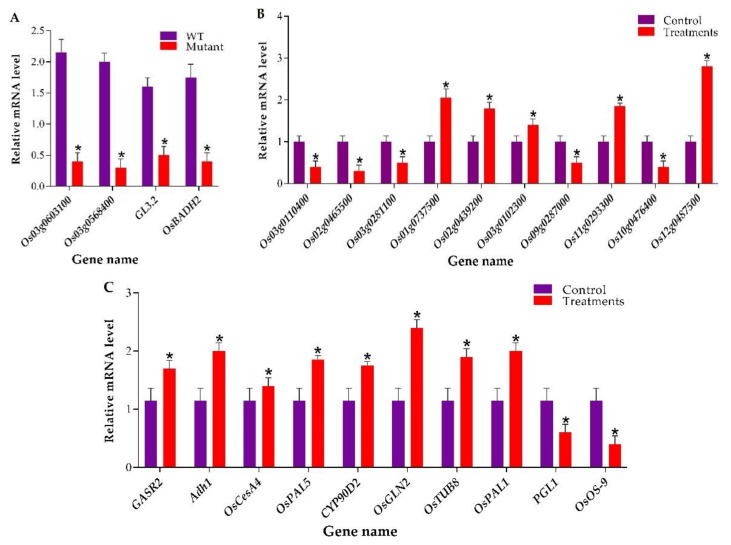
Figure 5.
RT-qPCR-based assessment of target genes expression analysis and validation of transcriptome and proteomic experiments. (A) Expression level of Os03g0603100, Os03g0568400, GL3.2, and OsBADH2 in wild-type (WT) and mutant plants (B) Expression analysis of ten selected DEGs and (C) genes associated with DEPs. * Denotes a significant difference, student’s t-test, p ≤ 0.01, n = 3.

