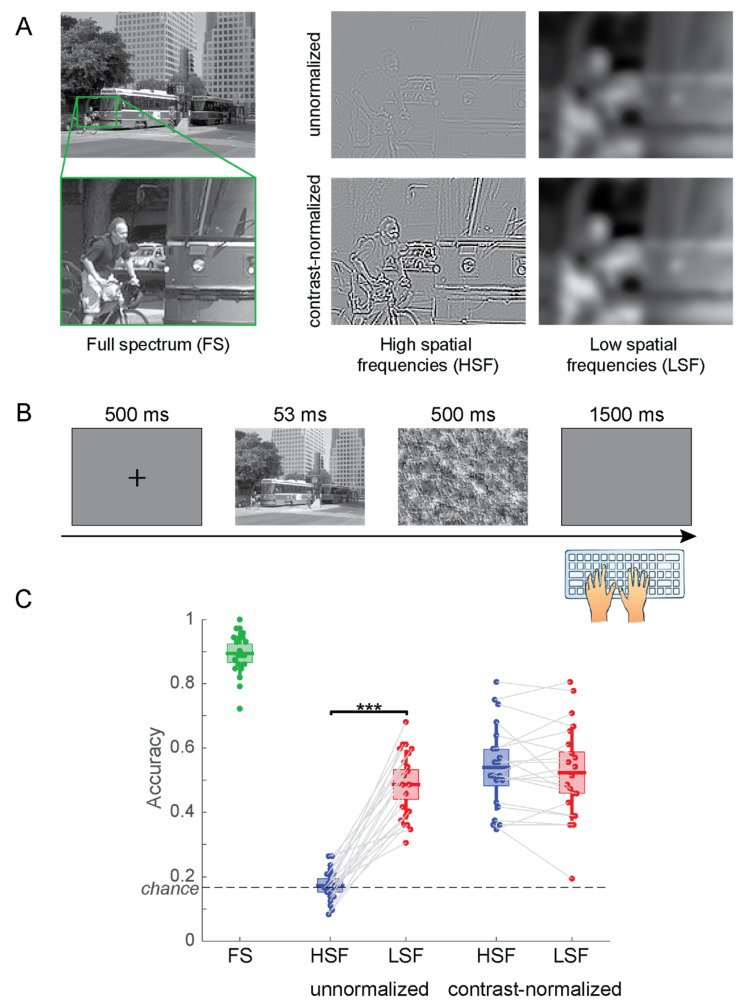
Figure 3.
(A) Example stimuli for Experiment 1. To better illustrate the effects of the filtering choices, we display enlarged sections of the actual stimuli. (B) Time course of the experiment. (C) Accuracy of scene categorization for the five types of stimuli. The center lines of the boxes indicate the mean, the extent of the box the standard error of the mean, and the whiskers the standard deviation of the individual data points. *** p < 0.001.

