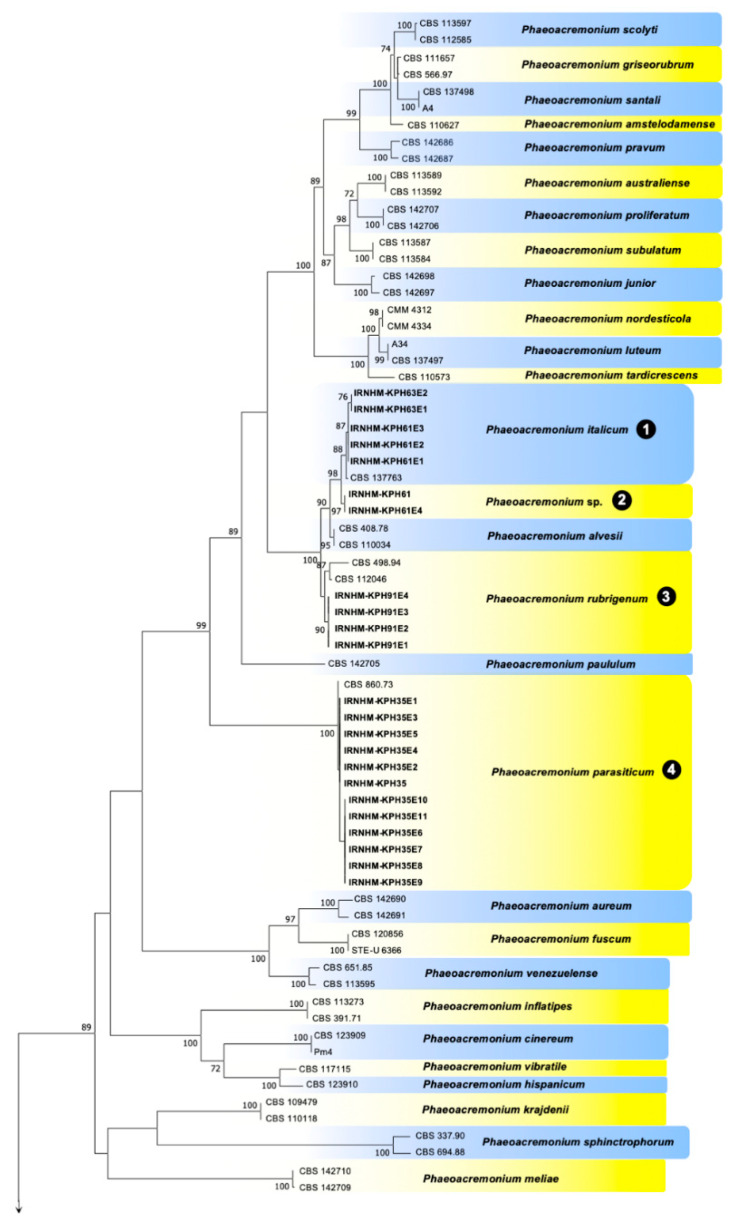
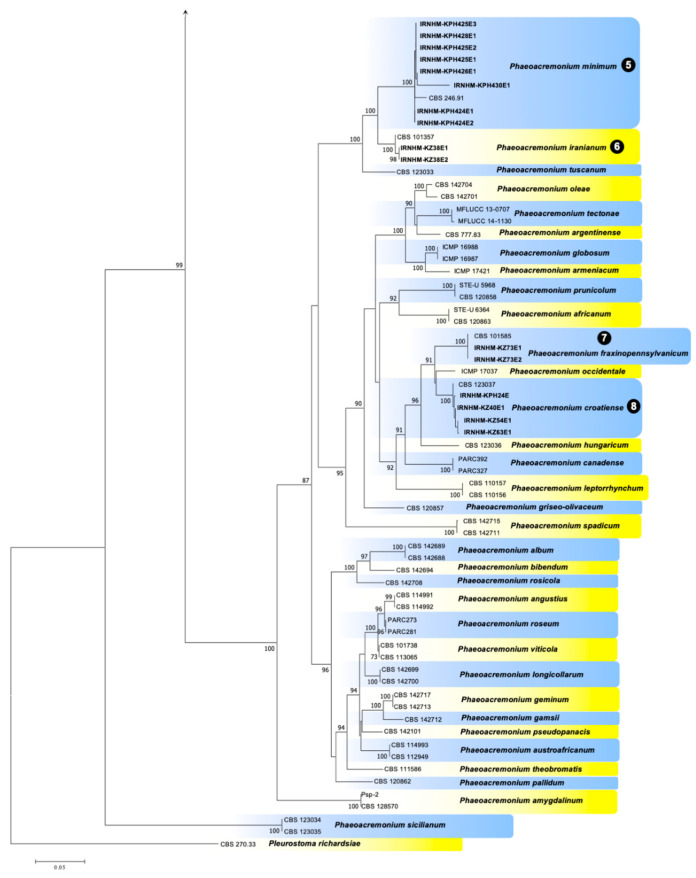
Figure 2.
Maximum likelihood phylogeny of Phaeoacremonium spp. according to concatenated alignments of the actin (ACT) and beta-tubulin (BT) gene regions. Support values less than 70% bootstrap were omitted. Maximum likelihood bootstrap percentages are indicated at the nodes. Isolates obtained in this study are indicated in bold. The eight clades associated with the Phaeoacremonium spp. obtained in this study are indicated by numbers.


