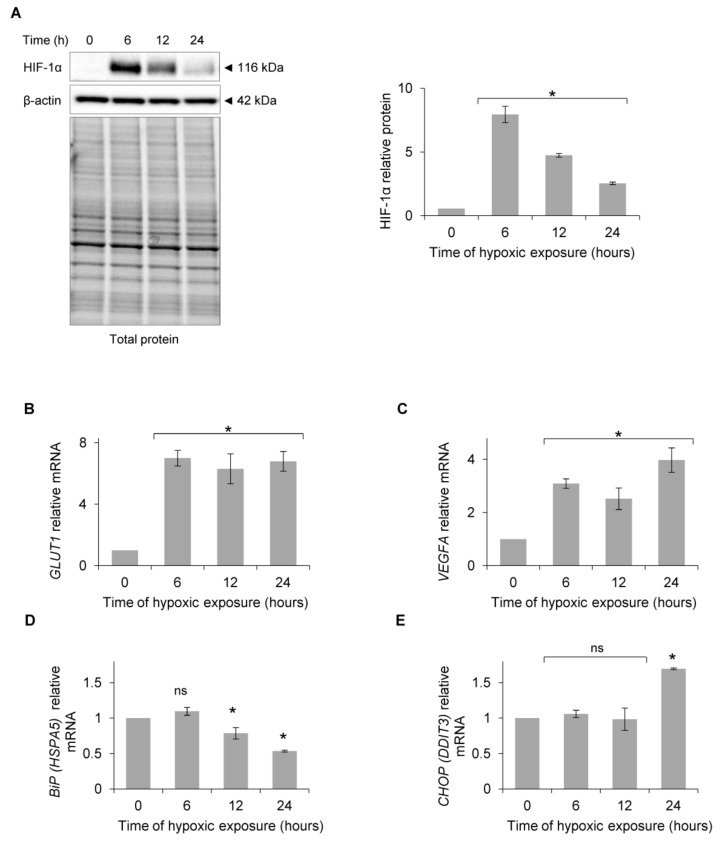
Figure 1.
Primary HUVECs were exposed to hypoxia (0.9% O2) for up to 24 h. (A) HIF-1α protein levels were evaluated at the specified time points by Western Blotting, normalized to β-actin and total protein levels and related to the time of hypoxic exposure. The densitometry analysis is representing two independent experiments (* p < 0.05 was considered significant). (B) GLUT1 (SLC2A1), (C) VEGFA, (D) BiP (HSPA5) and (E) CHOP (DDIT3) mRNA levels were quantified by quantitative real-time PCR and normalized to 18S and RPLP0 rRNA levels and expressed as a fold change over normoxic samples. Data represent the mean ± SEM of four independent experiments.

