Figure 1.
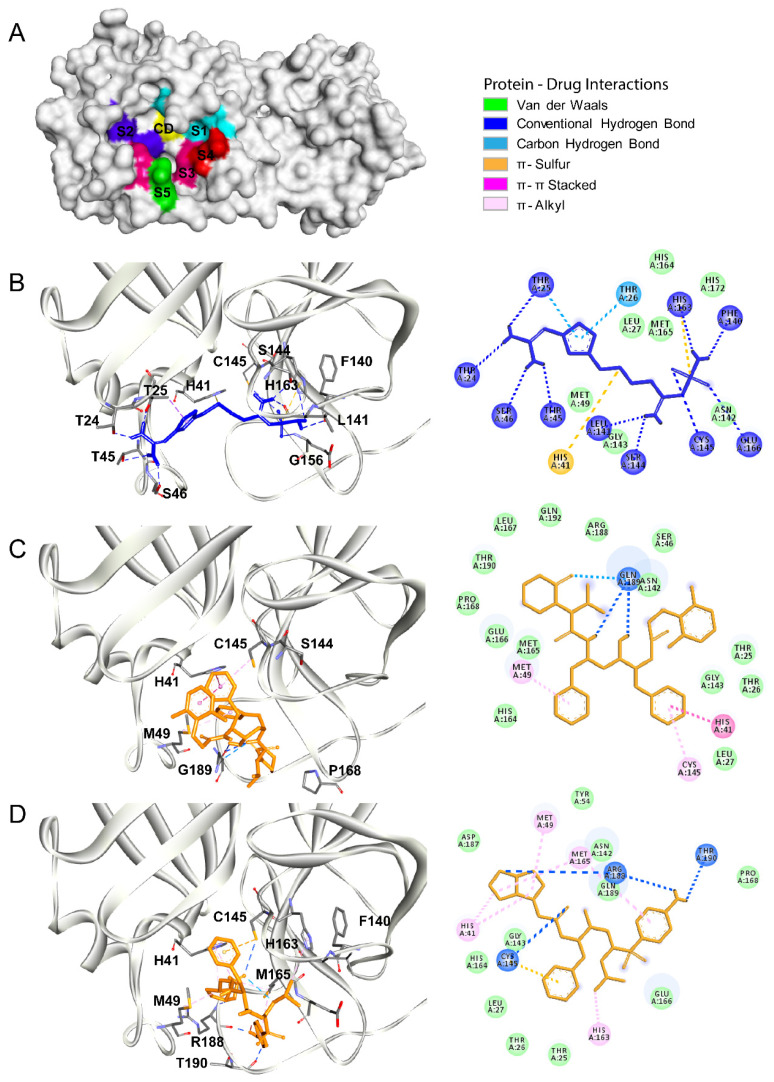
The Severe Acute Respiratory Syndrome Coronavirus type 2 (SARS-CoV2) main protease as a drug target. (A) The surface representation of the three-dimensional (3D) structure of the SARS-CoV2 main protease (Protein Data Bank (PDB) identifier (ID): 6LU7). The structural subdomains are indicated with different colors. The catalytic domain (CD) with the His41/Cys145 dyad is shown in yellow. Subdomains S1 (His163, Glu166, Cys145, Gly143, His172, and Phe140), S2 (Cys145, His41, and Thr25), S3 (Met165, Met49, and His41), S4 (Met165 and Glu166), and S5 (Gln189, Met165, and Glu166) are shown in cyan, dark blue, magenta, red, and green, respectively. (B–D) Molecular docking of famotidine, lopinavir, and darunavir into the catalytic site of the SARS-CoV2 main protease. The 3D structures of the protein–drug complexes are shown on the left. The protein is represented in ribbon, and drug ligands are shown as sticks. Famotidine is shown in dark blue, while lopinavir and darunavir are shown in orange. The main interacting residues are also indicated. The 2D diagrams of the main interaction networks between the drug ligand and the residues within the protease active site are shown on the right. The specific types of interactions are indicated in the legend. The final 3D structures and 2D diagrams of the protein–drug complexes were visualized with the Biovia Discovery Studio Visualizer 17.2.0 software.

