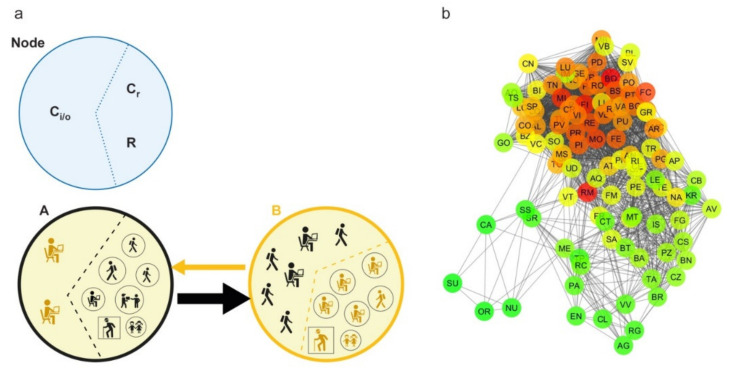
Figure 2.
Commuting network structure. (a) All categories of commuters and noncommuters that characterize each node of the network on a typical working day are represented: commuters inside the node (Cr), incoming and outgoing commuters (Ci and Co, respectively) and residents who are not commuters (R). The edge between two nodes, from a source to a destination, is represented by an arrow (direction) and its size is proportional to the number of commuters moving daily. (b) Graph representation of the commuting network at the province level (undirected for display purposes). The scale color from green to red is based on the node degree value.

