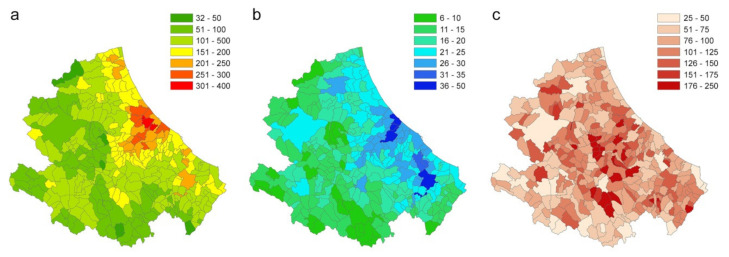
Figure 15.
(a) Number of infected people (95th percentile) that each municipality causes in the region (excluding itself). (b) Number of infected municipalities caused by each seed (95th percentile). (c) Ratio between the number of cases caused outside the municipality (95th percentile) and the number of cases caused inside the municipality (95th percentile).

