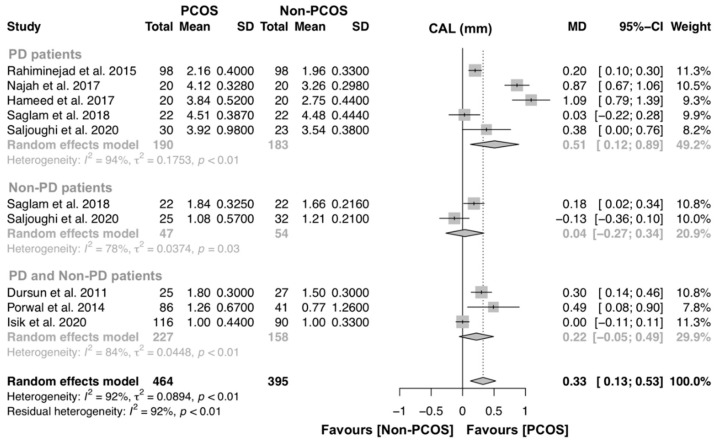
Figure 6.
Forest plot of studies evaluating clinical attachment loss (CAL) levels in PD patients with and without PCOS (p-value = 0.0014). Mean effect size estimates have been calculated with 95% confidence intervals and are shown in the figure. Area of squares represents sample size, continuous horizontal lines and diamonds width represents 95% confidence interval. Diamond and the vertical dotted line represent the overall pooled estimate.

