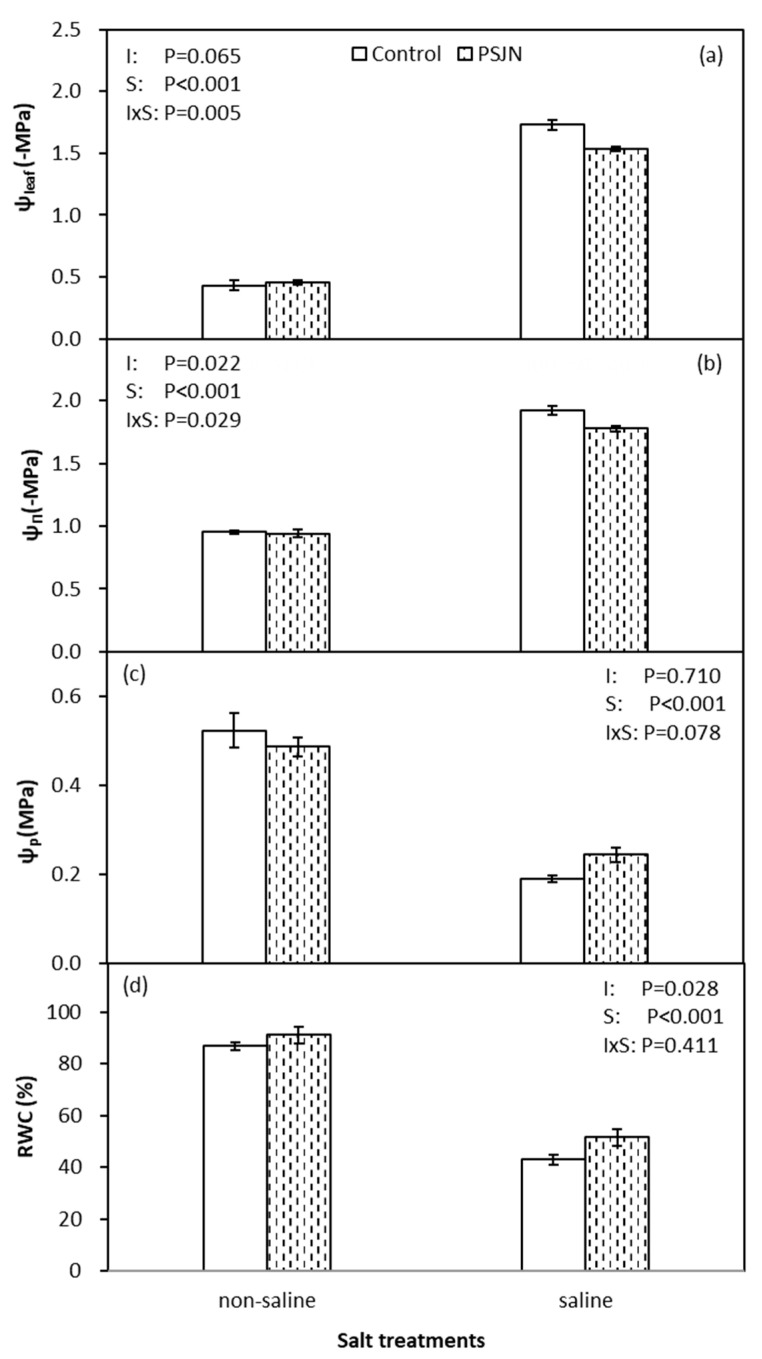
Figure 2.
Leaf potential (Ψl) (a), osmotic potential (Ψπ) (b), turgor potential (Ψp) (c) and relative water content (RWC) (d) of quinoa affected by bacterial inoculation in non-saline (0 mM NaCl) and saline (400 mM NaCl) irrigations. PsJN indicates Burkholderia phytofirmans PsJN. I and S indicate inoculation and salinity treatments, respectively, and I × S indicates the interaction. Error bars indicate S.E. (n = 4).

