Figure 5.
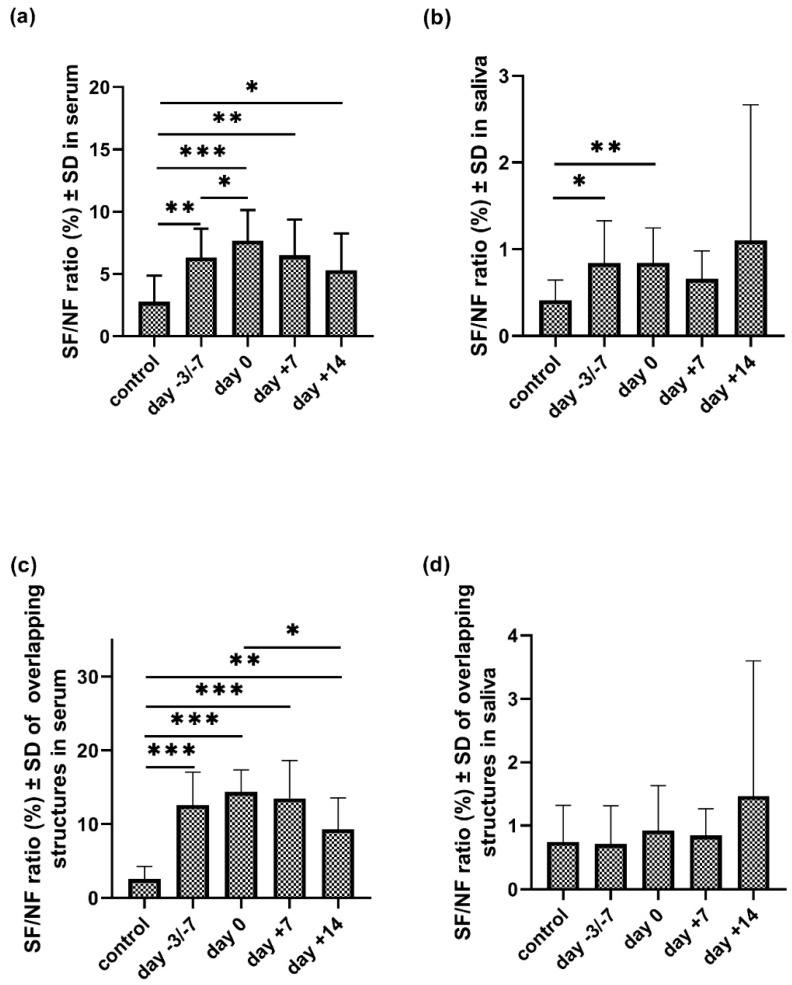
The sialoform to neutral (SF/NF) carbohydrate ratio (%) of serum (a) and salivary (b) IgA total N-glycans and the overlapping (i.e., present both in serum and saliva) structures (c,d) in the control and patient group at four stages of autologous peripheral stem cell transplantation (APSCT). Values are expressed as sample means; error bars represent the estimates of standard deviations calculated from three parallel measurements (* p ˂ 0.05, ** p ˂ 0.01, *** p ˂ 0.001).

