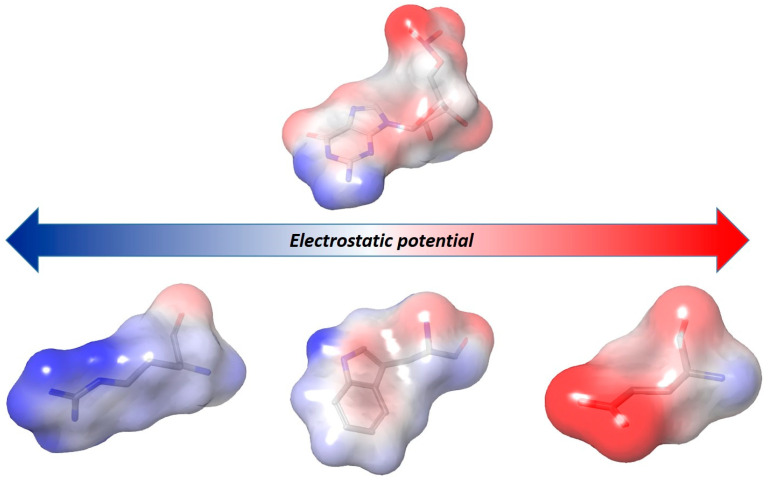
Figure 4.
Comparison of the different charge distribution represented by electrostatic surface between polar amino acids (from left: arginine, tryptophan, and glutamate) and a nucleotide as guanosine monophosphate. The color ramp indicates in red the negative electrostatic potential energy values and in blue the positive values.

