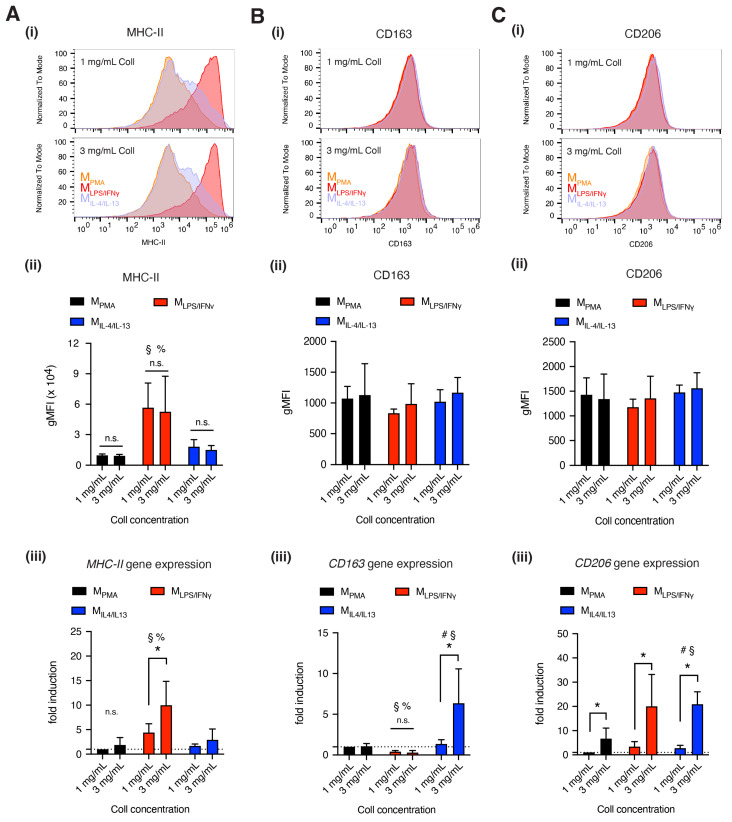
Figure 2.
Quantitative analysis of THP-1 derived macrophage surface markers. (A) MHC-II, (B) CD163 and (C) CD206 were analyzed at both the protein level and gene expression. All subfigures, (i) depicts the representative histogram plot of stained cells as a function of fluorescence signal intensity. The respective quantitative analysis of geometric mean of the fluorescence intensity is shown in subfigure (ii) All experiments were performed at least in triplicate. Gene expression was quantitatively analyzed using quantitative polymerase chain reaction (qPCR) and the results are shown in subfigures (iii) Data are represented as mean ± SD; * significance level of p < 0.05. The characters #, §, % represent the significance level of p < 0.05 when compared to MPMA, MLPS/IFNγ, and MIL-4/IL-13 macrophages, respectively.

