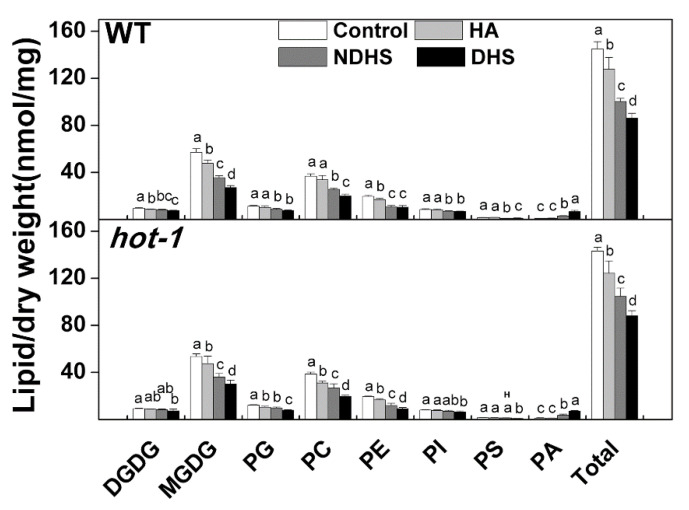
Figure 2.
Effects of heat shock on the total content of glycerolipids in various head group classes in wild-type Arabidopsis and hot-1. Values shown are the mean ± SE; n = 4 or 5. Means with different letters are significantly different according to the least significant difference (LSD) test at P < 0.05 under heat shock. The letter “H” indicates that the amount of lipid was significantly higher (P < 0.05) in hot-1, compared to wild-type Arabidopsis at the corresponding treatment. HA: Heat acclimation; NDHS: Heat shock with heat acclimation; DHS: Direct heat shock.

