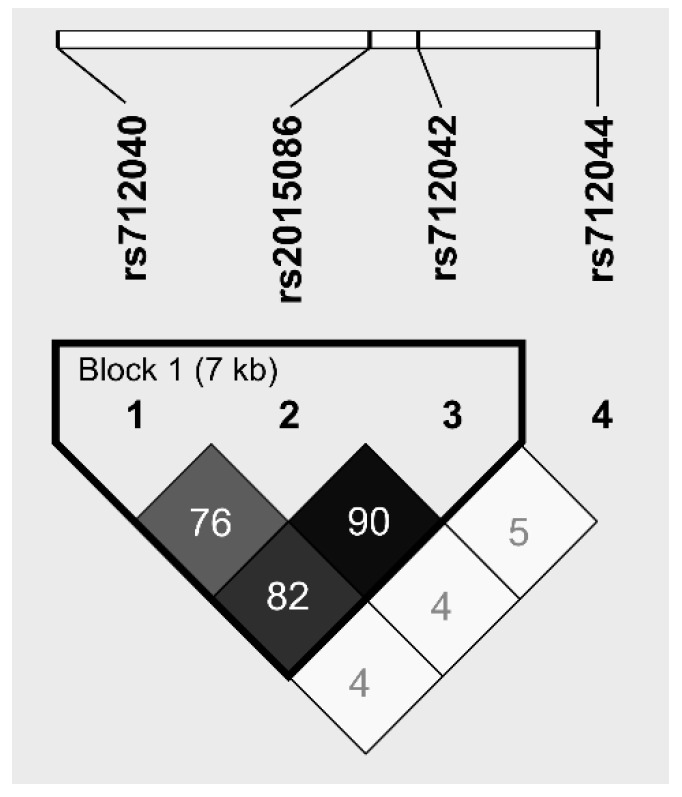
Figure 1.
Linkage Disequilibrium (LD) map of four SNPs in the CCL18 gene: rs712040 (location: CCL18 promotor), rs2015086 (location: CCL18 promotor), rs712042 (location: CCL18 intron), rs712044 (location: CCL18 intron). The dark squares represent high r2 values and the triangle represents a haplotype block.

