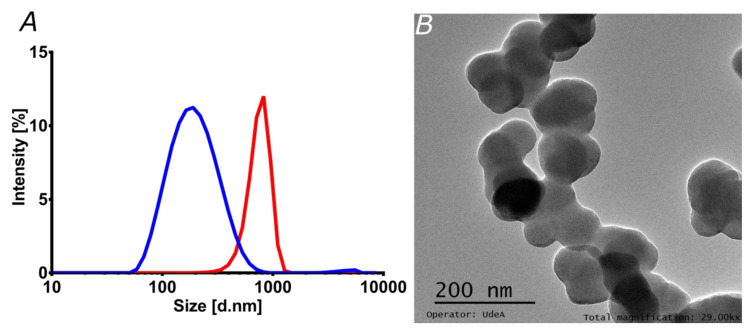
Figure 3.
Characterization of liposomes and magnetoliposomes. (A) Liposomes (blue) and magnetoliposomes (red) size distribution by Dynamic Light Scattering. The size was estimated using the refractive index and absorbance parameters of the phospholipid membrane. (B) TEM image of the liposomes synthesized by the hydration of the lipid bilayer method.

