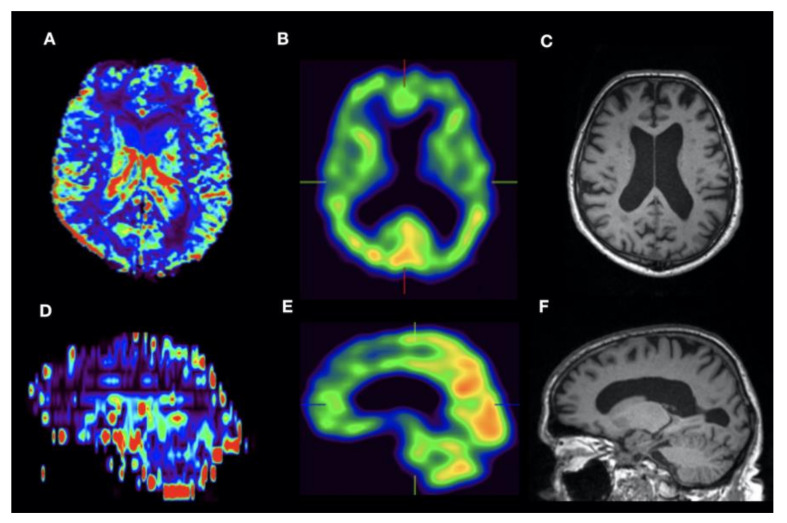
Figure 4.
Male with FTD, 69 y, Mini-Mental-Status-Test score 30. DSC Perfusion (A, axial orientation; D, sagittal orientation rCBVc map) shows typical pattern of frontal cortical hypoperfusion. Correlation with HMPAO-SPECT (B,E) and the anatomical dataset with ventricular widening as sign of atrophy (T1w in C and F).

