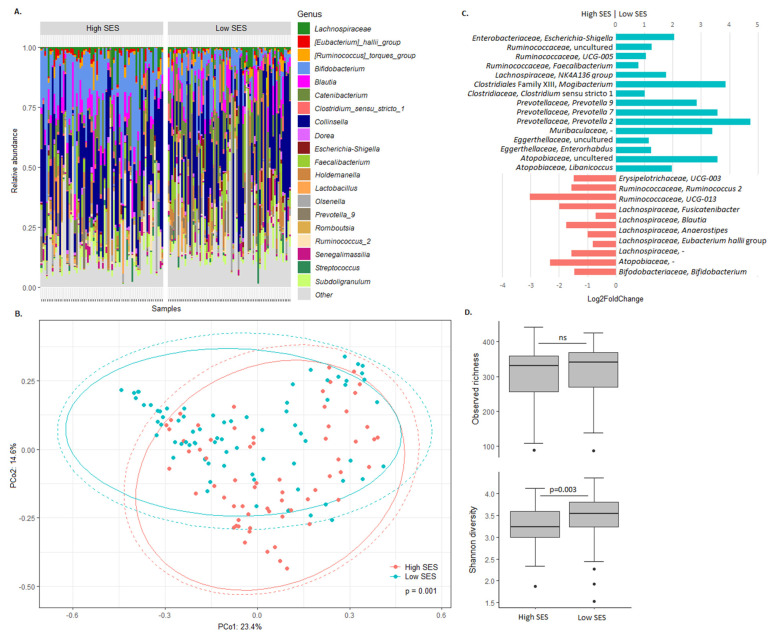
Figure 1.
Association between the bacterial gut microbiota and SES. (A) Taxonomic profiles of the gut microbiota of high and low SES children. The 20 most abundant bacterial taxa are shown. Relative abundance of all other taxa is summed and labelled as ‘other.’ (B) The Bray–Curtis dissimilarity-based principal coordinate analysis plot labelled according to SES. Ellipses indicate confidence assuming a multivariate t-distribution (solid line) or a multivariate normal distribution (dotted line). (C) Differential abundance of bacterial taxa between high and low SES children. Taxa with Benjamini–Hochberg corrected p-value below 0.05 are shown. (D) Alpha diversity in high and low SES children. Boxplots show the median, 25th and 75th percentiles, and minimal and maximal values with the exception of outliers (black circles).

