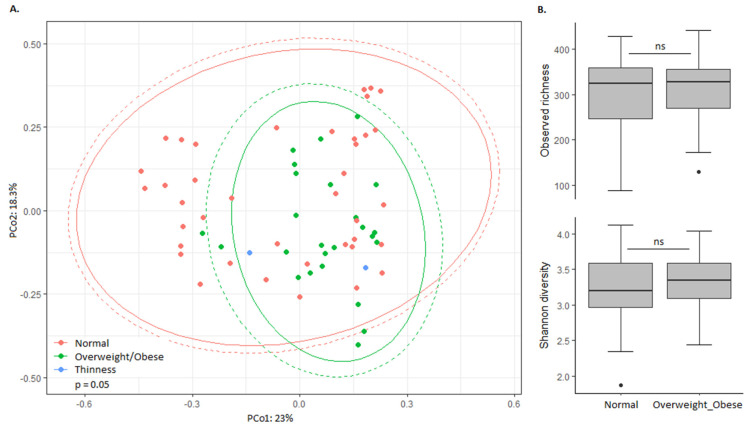
Figure 2.
Association between the bacterial gut microbiota and nutritional status in high SES children. (A) The Bray–Curtis dissimilarity-based principal coordinate analysis plot labelled according to nutritional status. Ellipses indicate confidence assuming a multivariate t-distribution (solid line) or a multivariate normal distribution (dotted line). (B) Alpha diversity in high SES children with normal weight and overweight/obesity. Boxplots show the median, 25th and 75th percentiles, and minimal and maximal values with the exception of outliers (black circles).

