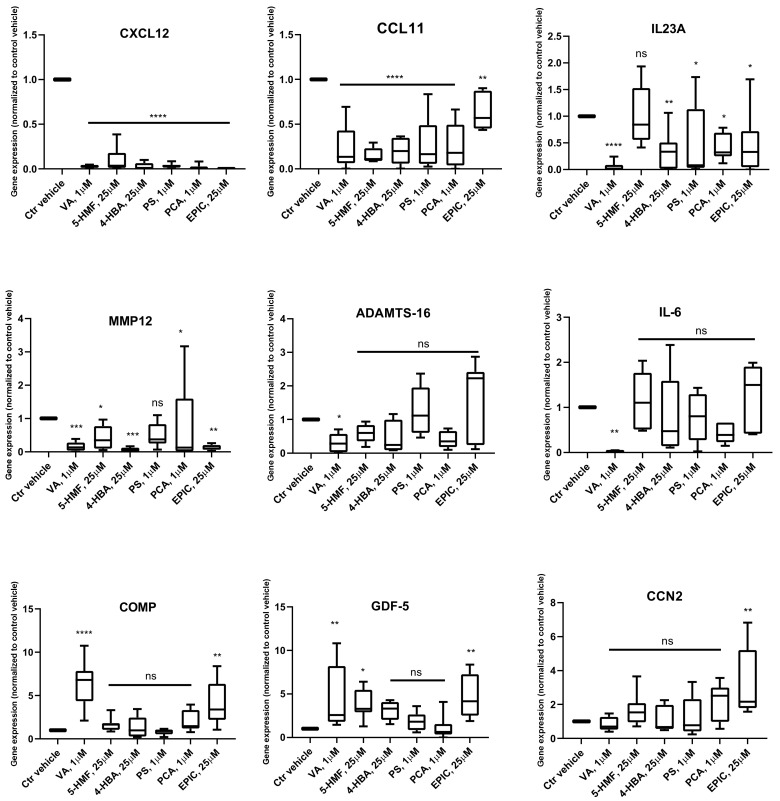
Figure 1.
qPCR data showing transcriptional levels of genes differentially expressed in RNA sequencing dataset in compound treated versus control vehicle (Ctr vehicle) group in human osteoarthritis (OA) chondrocytes. n = 4; n indicates the number of human OA donors; for each donor, three experimental replicates were analyzed. Data are normalized to the levels of control groups. For statistical analysis using Graphpad Prism, one-way analysis of variance (ANOVA) followed by Dunnett’s post hoc test (multiple comparisons) was applied. * p < 0.01, ** p < 0.001, *** p < 0.0005, **** p < 0.0001 vs. Ctr vehicle, ns (non-significant).

