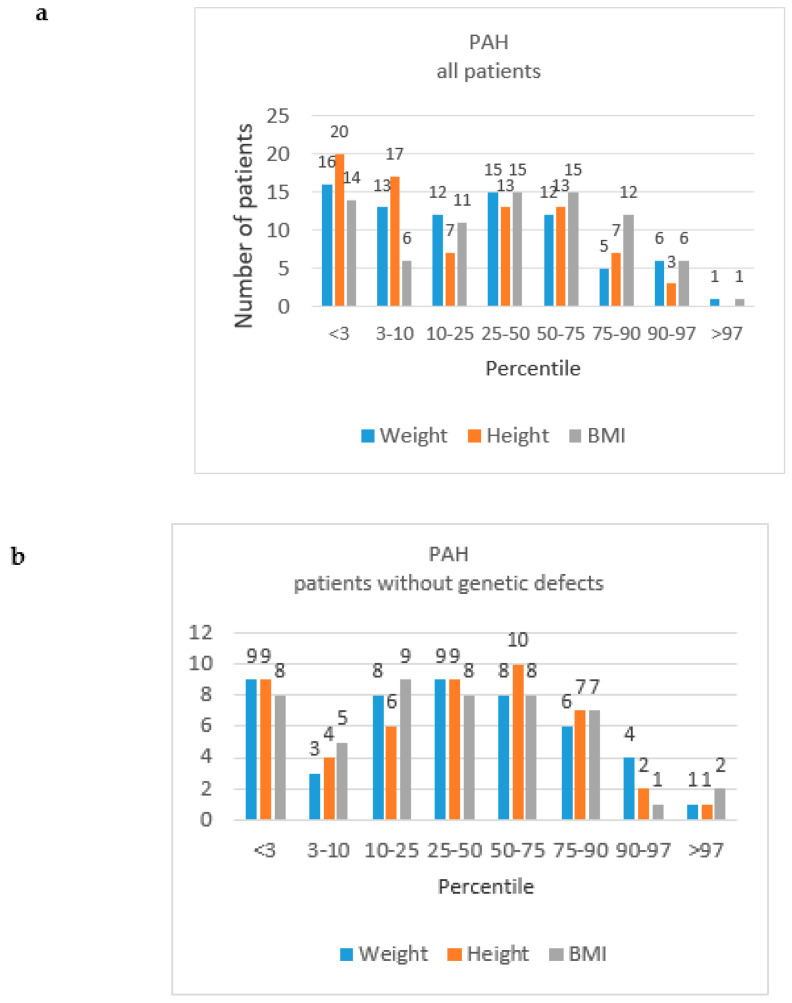
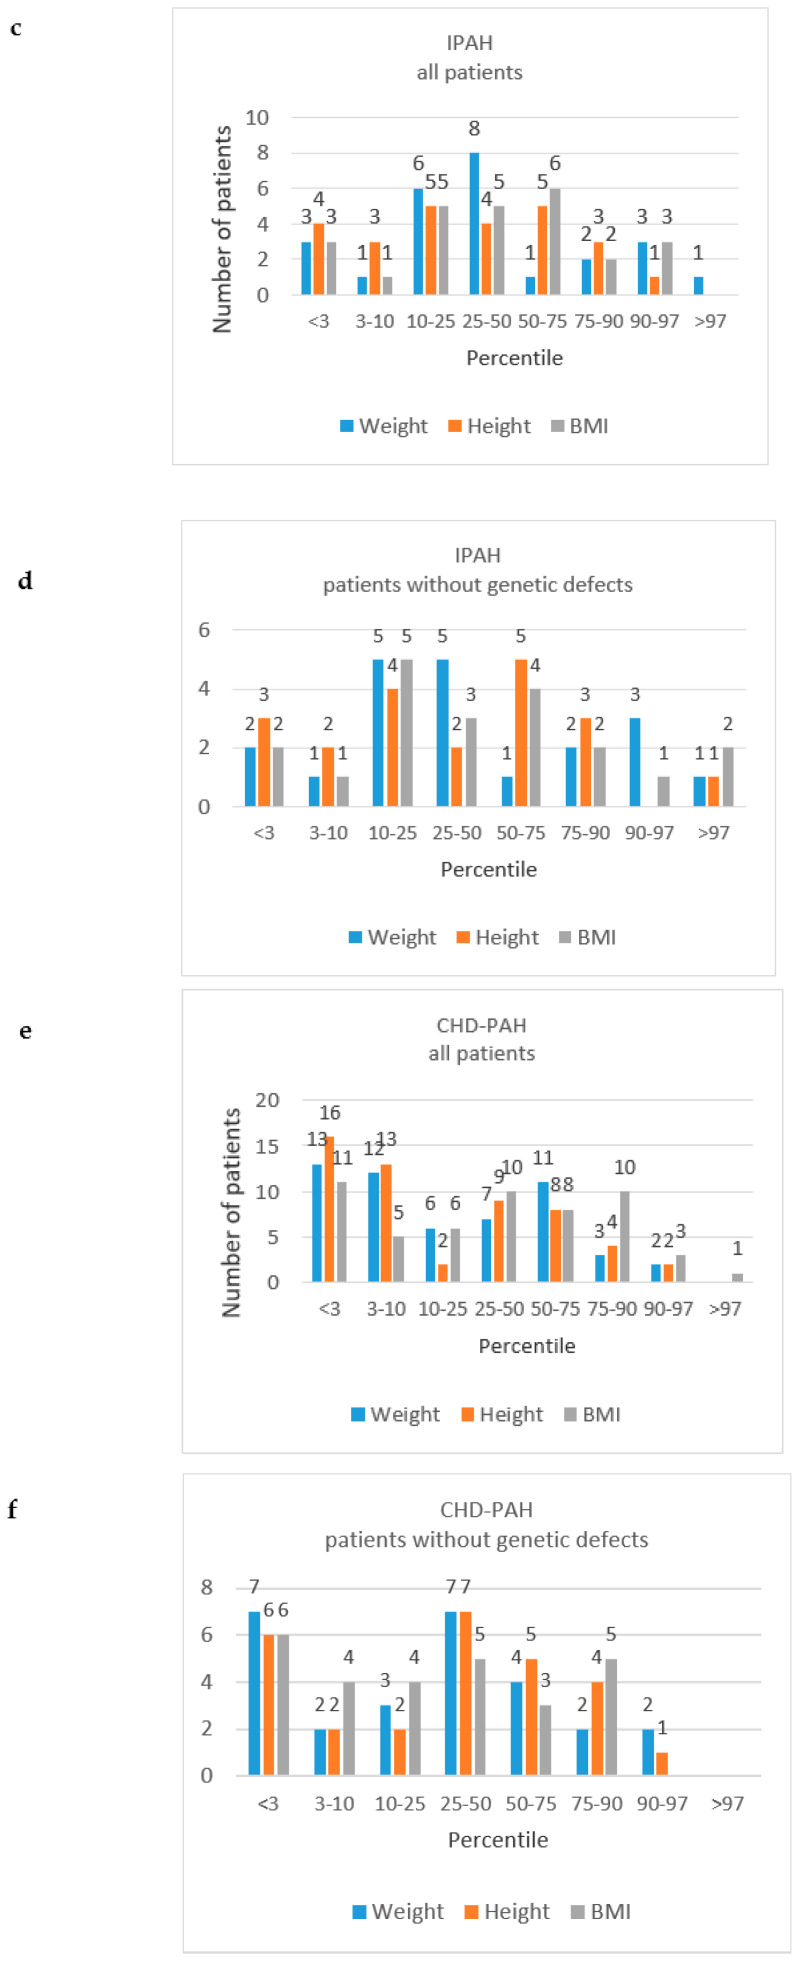
Figure 3.
The distribution of the number of patients with PAH by weight, height and body mass index (BMI) percentiles, by “all patients” study groups and “patients without genetic defects” groups. (a) PAH, all patients; (b) PAH, patients without genetic defects; (c) IPAH, all patients; (d) IPAH, patients without genetic defects; (e) CDH-PAH, all patients; (f) CDH-PAH, patients without genetic defects.


