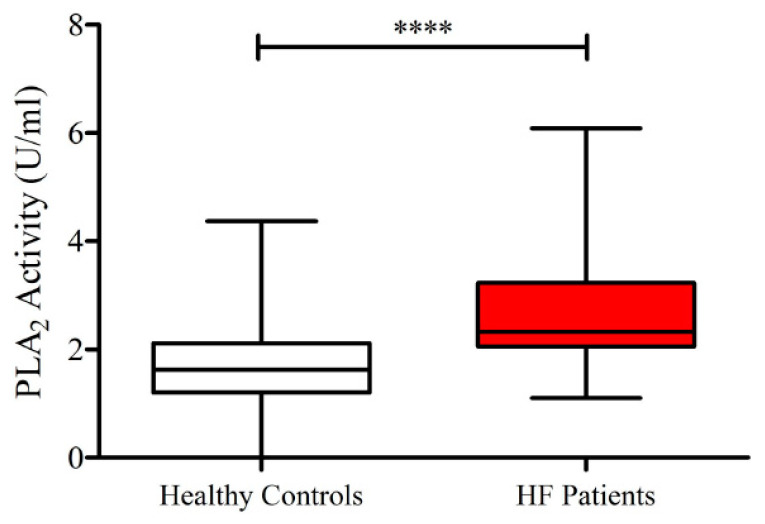
Figure 3.
Plasma concentrations of sPLA2 activity in HF patients and in healthy controls. Data are shown as the median (horizontal block line), the 25th and 75th percentiles (boxes), and the 5th and 95th percentiles (whiskers) (statistical analysis was performed by a Student’s t-test). **** p < 0.0001.

