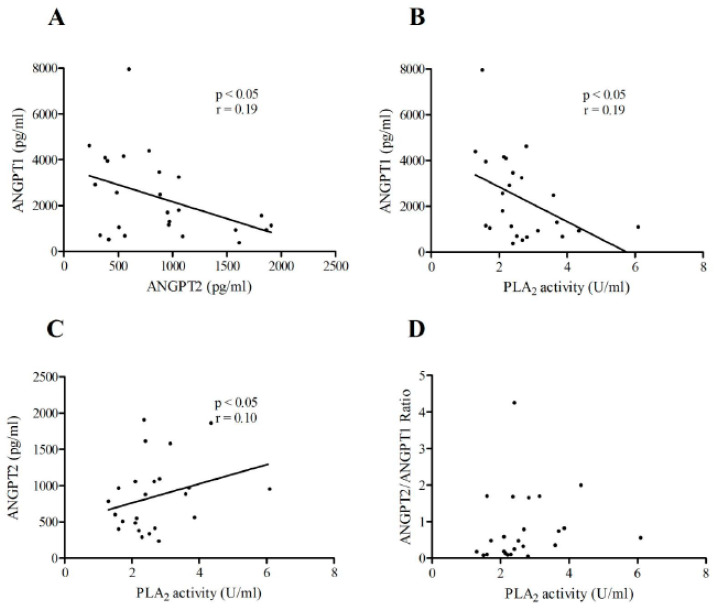
Figure 7.
(A) Correlations between the plasma concentrations of ANGPT2 and ANGPT1 in NIHF patients; (B) correlation between circulating sPLA2 activity and the concentration of ANGPT1 in NIHF patients; (C) correlation between the plasma concentration of sPLA2 activity and ANGPT2 in NIHF patients; (D) correlation between the plasma concentration of sPLA2 activity and the ANGPT2/ANGPT1 ratio in NIHF patients. Spearman’s correlation coefficients (r) were calculated and are shown in the panels.

