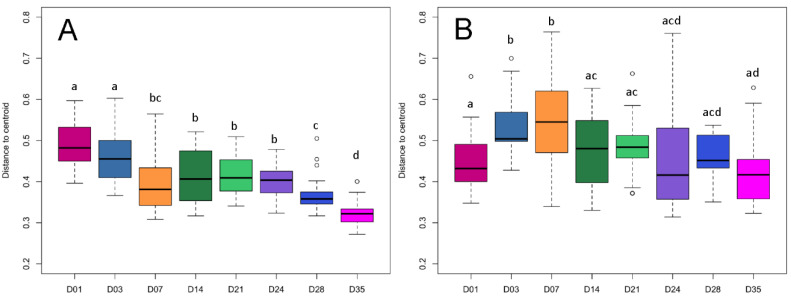
Figure 3.
Boxplot of pairwise distances between piglet feces centroids over time. Plots represent the median and interquartile range in the (A) bacteriome and (B) mycobiome over time (D01–35). Differences between organ centroids were analyzed using permutational analysis of multivariate dispersion using the betadisper function in the R-package vegan on Bray–Curtis dissimilarities. Significance is indicated by letters a–d and open circles represent outliers (p < 0.05).

