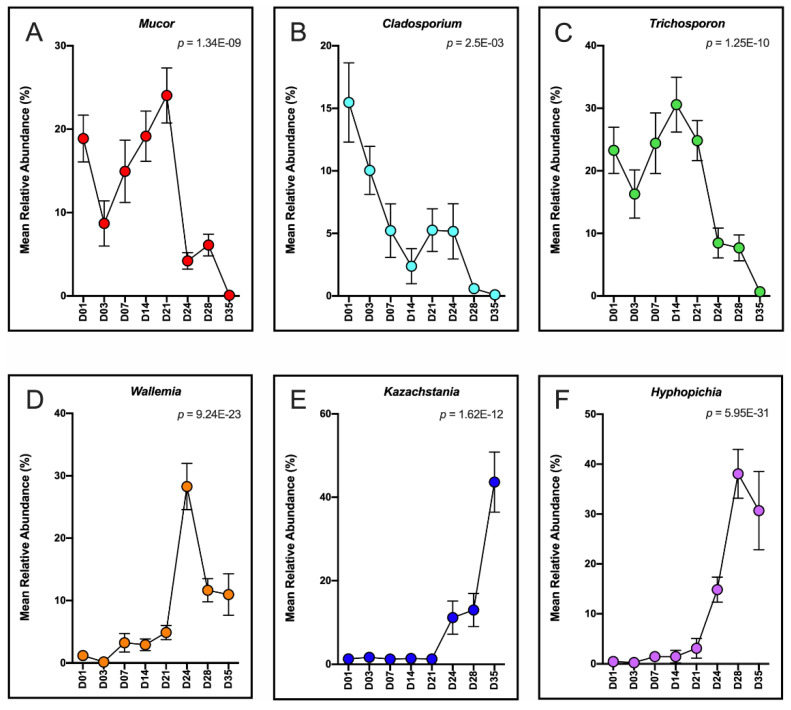
Figure 6.
Differentially abundant genera over time in the piglet pre- vs. post-wean fecal mycobiome. Trends in mean relative abundances of significant fungal genera representing the (A–C) pre-wean (D01–21) and (D–F) post-wean (D24–35) piglet fecal mycobiome. FDR-corrected p-values were calculated using a linear mixed-effect regression model controlling for individual piglet. Error bars represent ± SE. A complete list of differentially abundant fungus is found in Table S5B.

