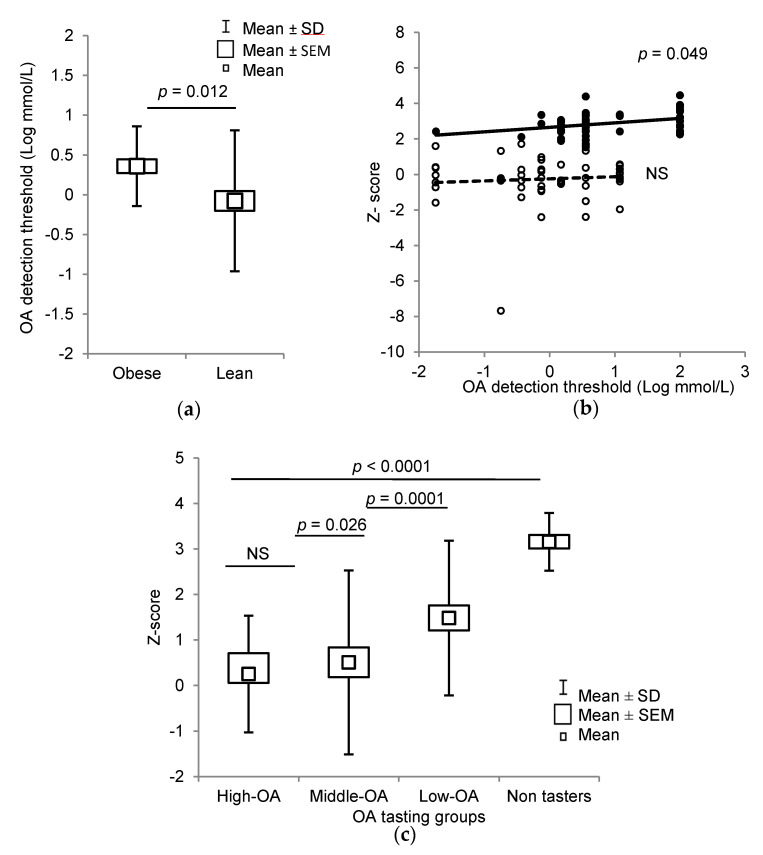
Figure 2.
Relationship between obesity and oleic acid (OA) detection thresholds in lean and obese children. (a) Box plots of OA orosensory detection thresholds in lean (n = 51) and obese subjects (n = 33). (b) Spearman rank correlation between z-score and OA orosensory detection thresholds in all the participants (n = 84), (open circles: lean children; closed circles: obese children). (c): The box plots of z-score vs. OA detection thresholds in Low-OA, Middle-OA, High-OA, and Non-taster groups (n = 102). The results are means ± SD (ANOVA and independent t-test); Non-tasters (NT, n = 18); NS: not significant (p > 0.05).

