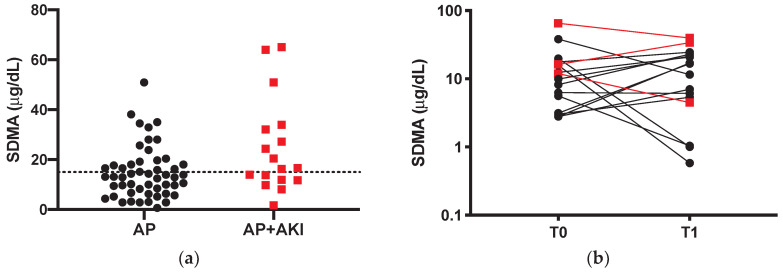
Figure 2.
(a) SDMA values of non-azotemic dogs with acute pancreatitis (AP; black dots) and in dogs with acute pancreatitis (AP) and acute kidney injury (AKI) (AP + AKI; red squares). The line represents the threshold values of 15 μg/dL. (b) Comparison between admission (T0) and first recheck (T1) SDMA of survivors (n = 16). A logarithmic (base 10) scale is used for the vertical axis. Black dots represent AP dogs and red squares represent AP + AKI dogs.

