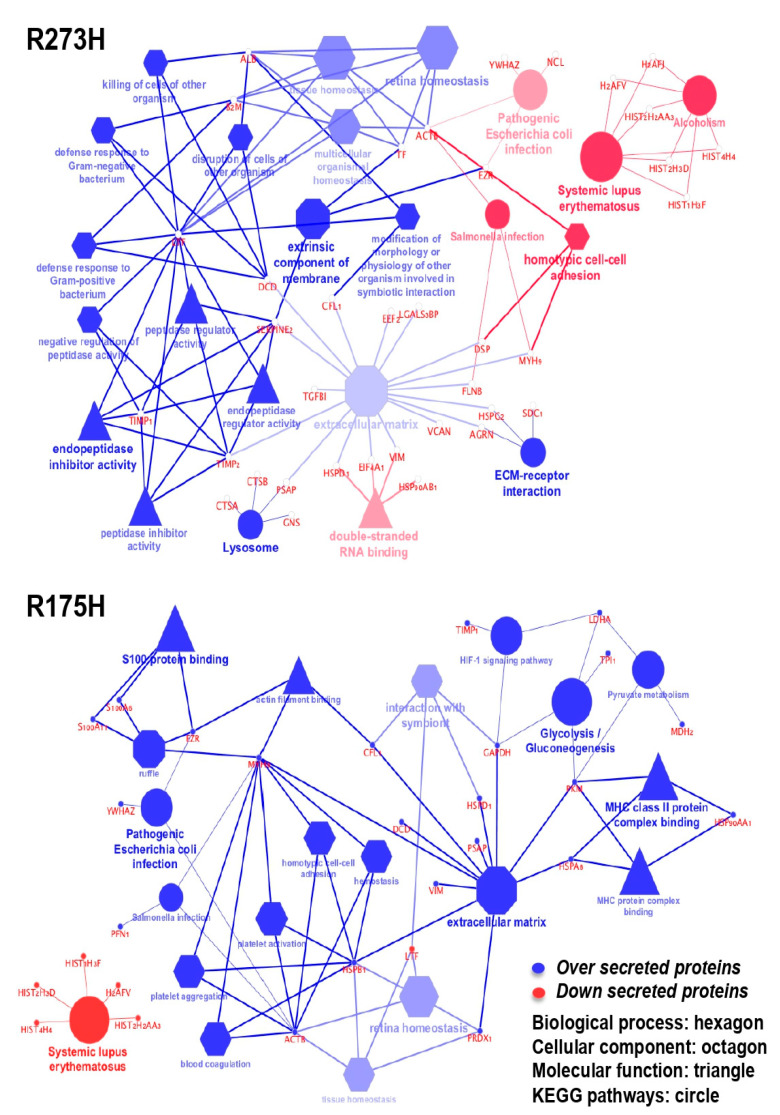
Figure 5.
Cytoscape-based ClueGo/CluePedia pathway analysis and visualization. The enriched pathways were derived by the Kyoto Encyclopaedia of Genes and Genome (KEGG) database. The figure reports the functionally grouped networks of regulated proteins in the R273H and R175H transfected cell line. Blue term indicates an abundance increase compared to the mock control while red term indicates an abundance decrease. Terms are linked based on к-score (≥0.4), edge thickness indicates the association strength while node size corresponds to the statistical significance for each term. Biological processes are represented with hexagons, cellular components with octagons, molecular functions with triangles and KEEG pathways with circles.

