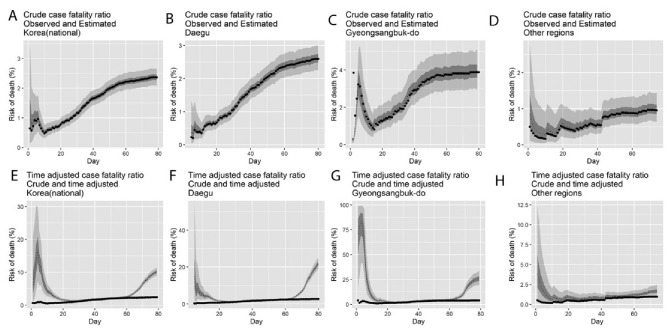
Figure 2.
Temporal variation of risk of death, Korea, February–May 2020. Observed and posterior estimates of the crude CFR in (A) Korea (national), (B) Daegu, (C) Gyeongsangbuk-do, and (D) other regions, and time-delay adjusted CFR in (E) Korea (national), (F) Daegu, (G) Gyeongsangbuk-do, and (H) other regions. Day 1 corresponds to February 1st, 2020. Black dots represent the crude CFR, the light and dark colors indicate 95% and 50% credible intervals for the posterior estimates, respectively.

