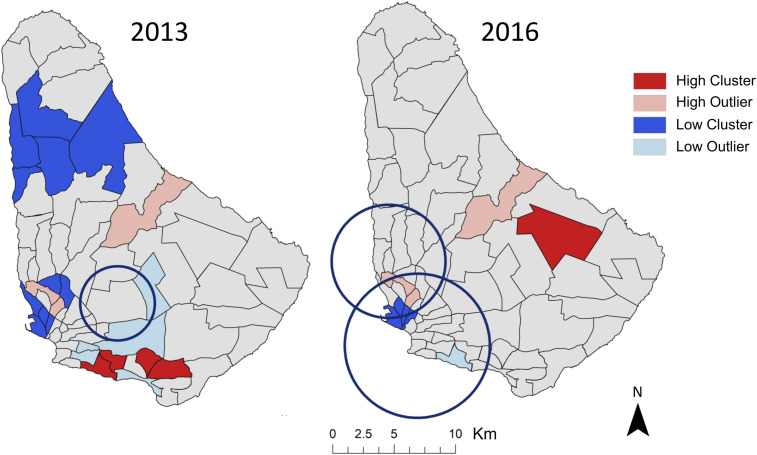
Figure 2.
Patterns of clustering (red) and dispersion (blue) of annual dengue case totals were found at the level of health district in Barbados in 2013 and 2016, as determined by Local Moran’s I. Spatiotemporal areas of low disease risk in monthly cases (blue circles), found via Kulldorff’s spatial scan statistic, were found in both years. This figure was produced in ArcMap 10.4 (ESRI). This figure appears in color at www.ajtmh.org.

