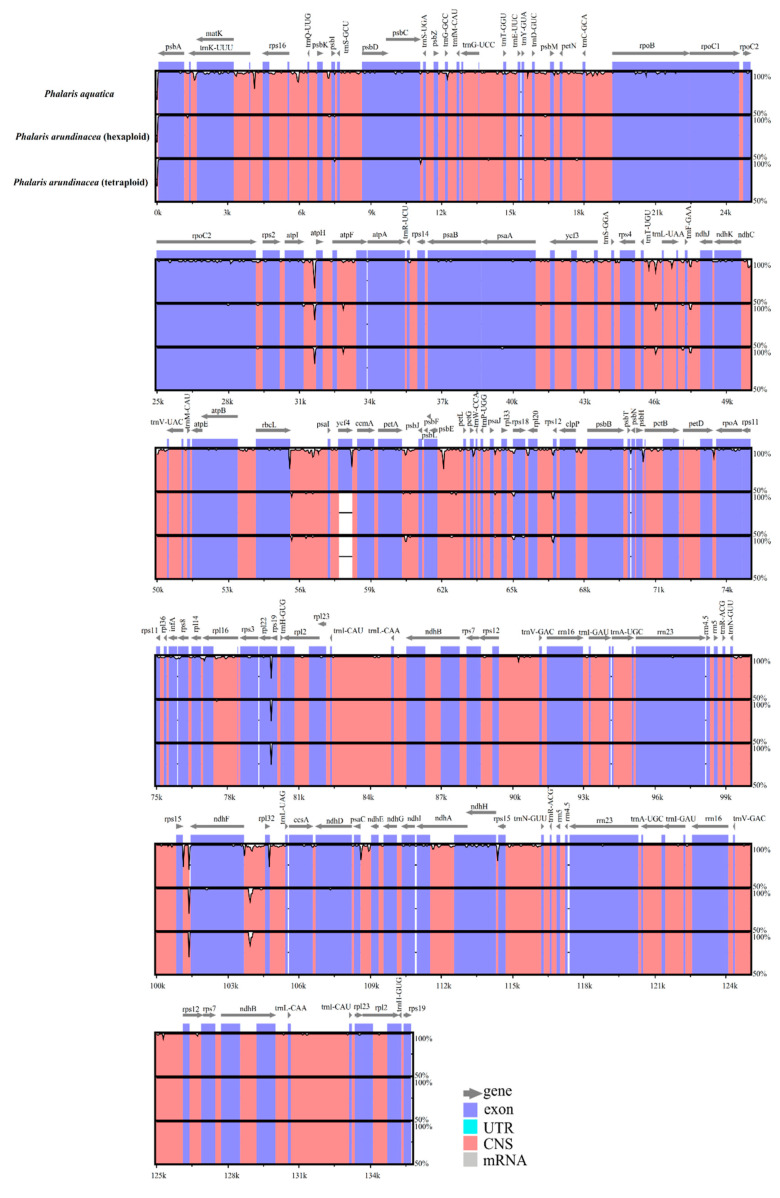
Figure 2.
Alignment of the Phalaris chloroplast genome sequences. Exon, untranslated region (UTR), conserved noncoding sequences (CNS), and mRNA were color-marked. The x-axis and horizontal bars represent the coordinate and sequences similarity in the chloroplast genome, and the peaks indicate hotspot regions.

