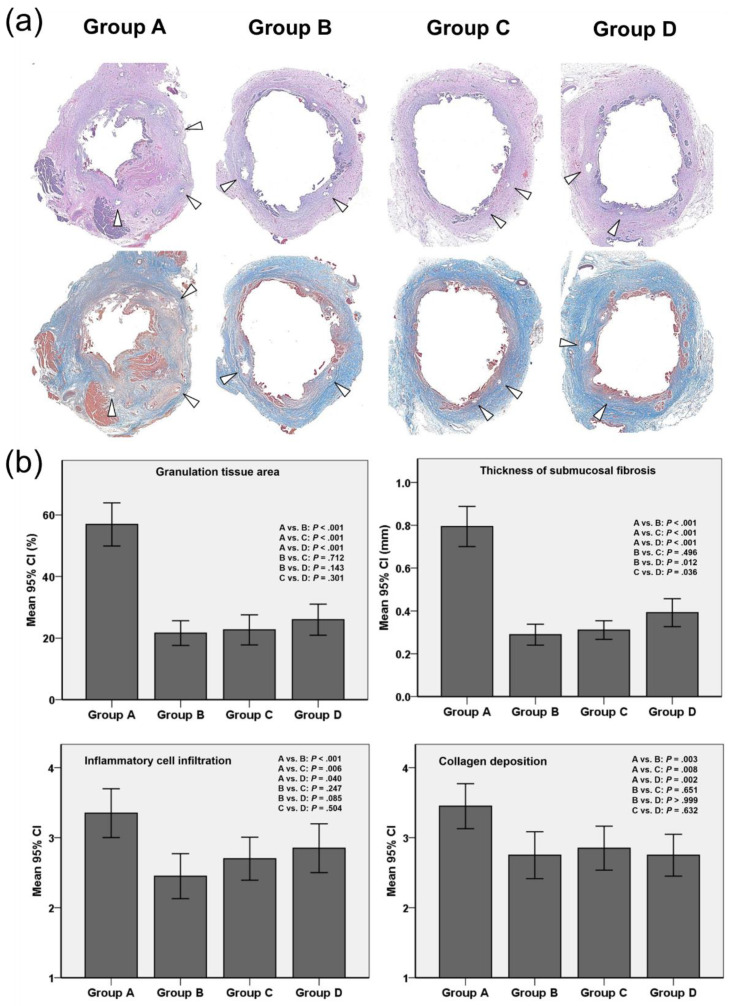
Figure 4.
Histological findings. (a) Representative microscopic images (hematoxylin-eosin staining, magnification 1.25×) showing significantly higher granulation tissue in group A than in groups B, C, and D. Masson’s Trichrome staining showing significantly greater connective tissue in group A than in groups B, C, and D; arrowheads = stent struts. (b) Histopathologic results of the stented extrahepatic bile duct in groups A, B, C, and D. Note: CI, confidence interval.

