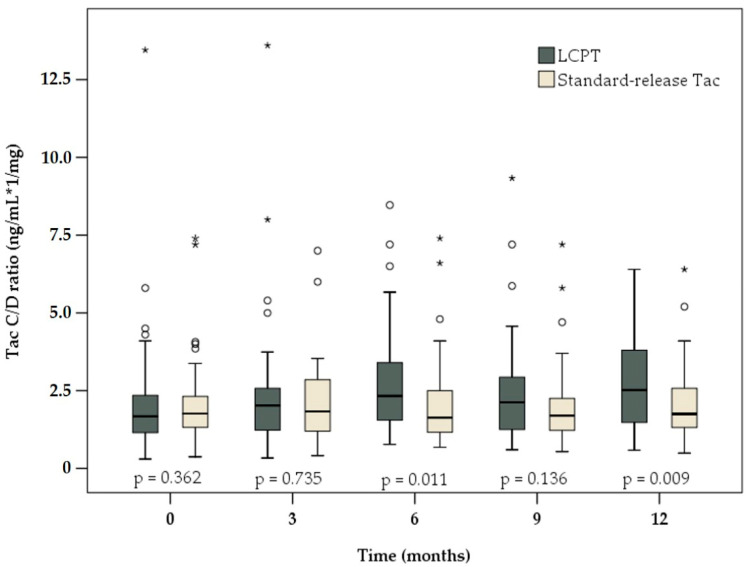
Figure 2.
Boxplots of C/D ratio among patients receiving LCPT (dark grey) or standard-release Tac (light brown) at baseline and 3, 6, 9 and 12 months later. There were significant differences between the two study groups at 6 and 12 months after conversion. p-values reflect differences between the groups at each time point.

