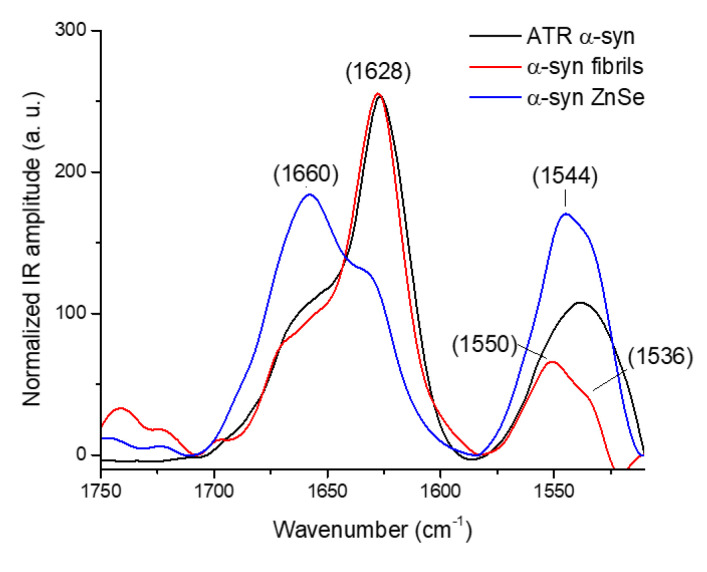
Figure 7.
AFM-IR spectra of the α-synuclein different species, normalized on the area of the amide I band. The red curve corresponds to the fibrils on the ZnS prism. The blue curve corresponds to fibrils from the same batch deposited on the ZnSe prism. The topography of the different species is available in Figure 6a,b respectively. The black curve is the reference spectrum for fibrils obtained by ATR-FTIR.

