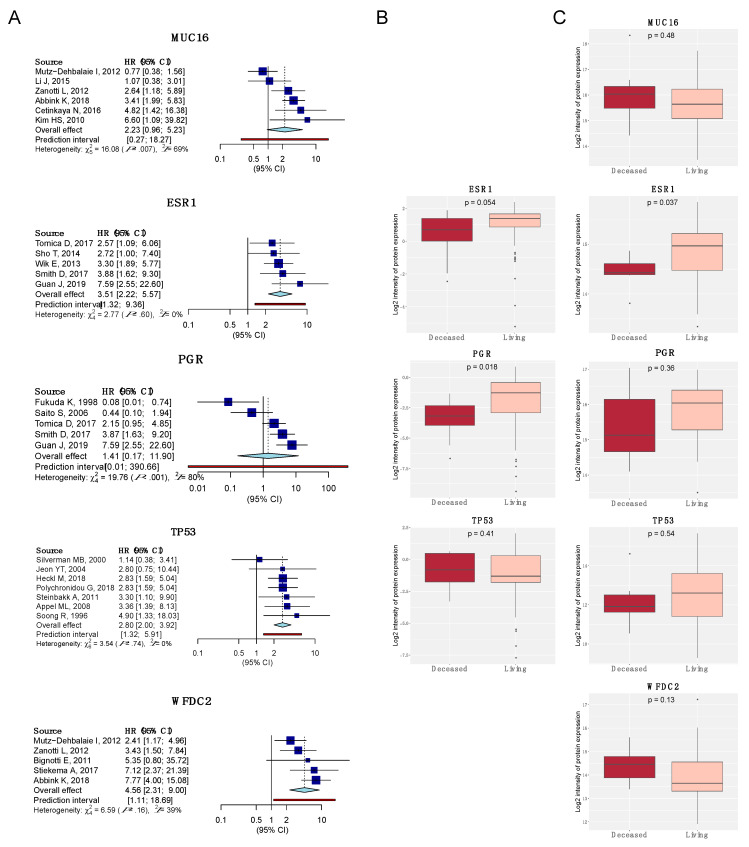
Figure 8.
Meta-analysis on OS of the most studied biomarkers regarding prognosis in EC (MUC16, ESR1, PGR, TP53, and WFDC2, respectively). (A) Forest plots. Diamond in light blue represents the point estimate and confidence intervals when combining all studies; (B) expression boxplots using the RPPA data of the TCGA cohort (n = 200:20 deceased–plotted in red; 178 living–plotted in light red) [15]; (C) Expression boxplots using the mass spectrometry data of the CPTAC cohort (n = 100:7 deceased–plotted in red; 38 living–plotted in light red) [32].

