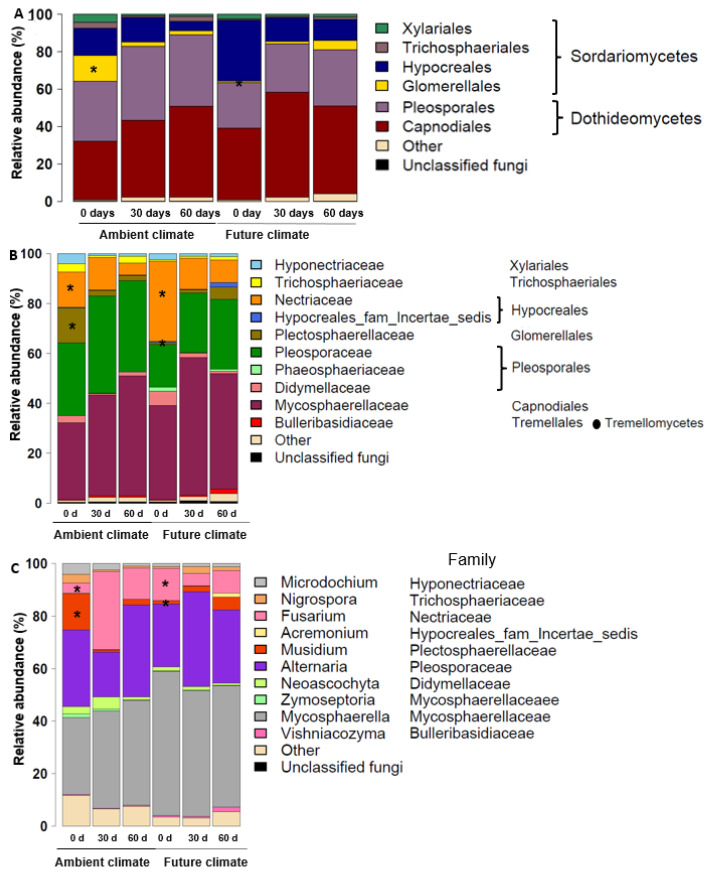
Figure 3.
Relative abundance of the dominant fungal taxa at (A) order, (B) family, and (C) genus level at different sampling times (0, 30, and 60 days) under ambient and future climate treatments. Asterisks indicate taxa that differ significantly under ambient and future conditions at 0 days (t-test, p < 0.05).

