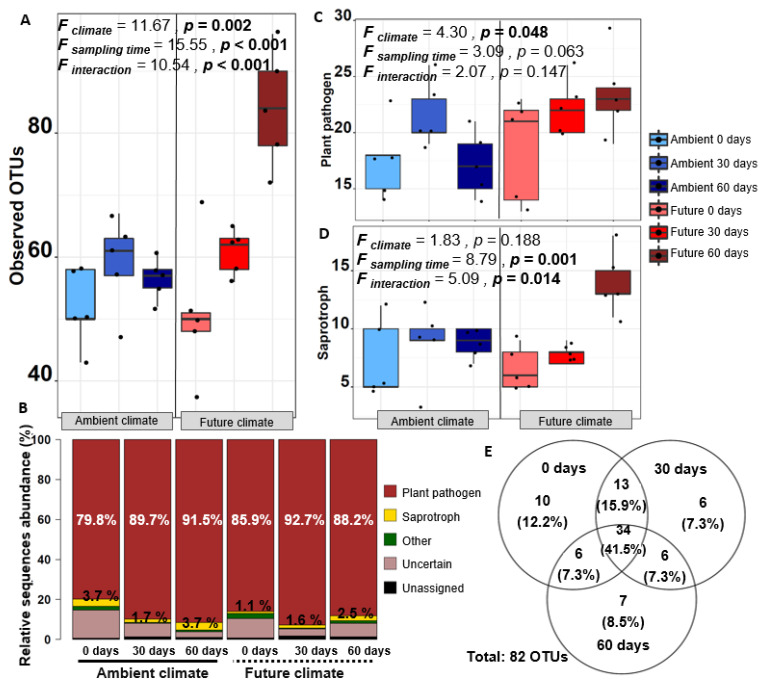
Figure 4.
(A) Box plots showing observed OTUs at each time point (0, 30, and 60 days) under ambient and future climate treatments, supported by the results of a two-way ANOVA; (B) Stacked bar chart showing the relative abundance of predicted fungal guilds using the FUNGuild annotation tool; Box plots showing observed richness of OTUs classed as (C) plant pathogens and (D) saprotrophs; (E) Venn diagram showing the overlap and distribution of fungal OTUs classed as plant pathogens, which colonize wheat straw at the three sampling time points (0, 30, and 60 days).

