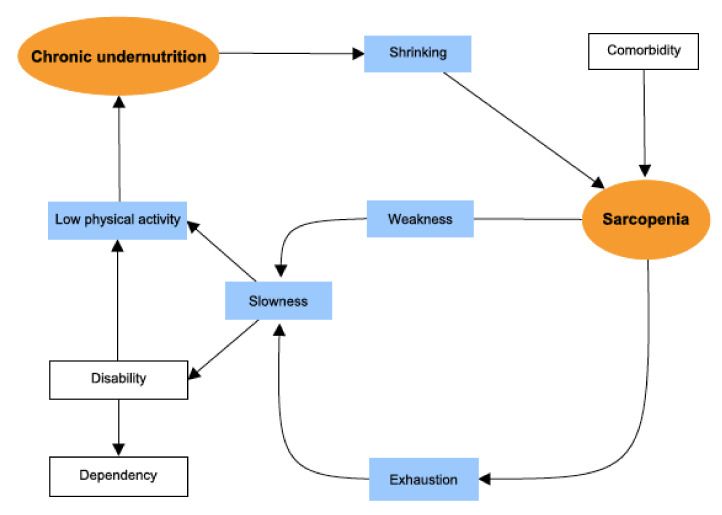
Figure 1.
Pre-specified structural equation modelling (SEM) of the pathophysiology cycle for frailty. By convention, circles (orange) represent latent variables and rectangles represent observed variables. Blue rectangle = Frailty criteria. The direction of the arrow indicates the hypothetical pathway, as proposed by Fried et al.

