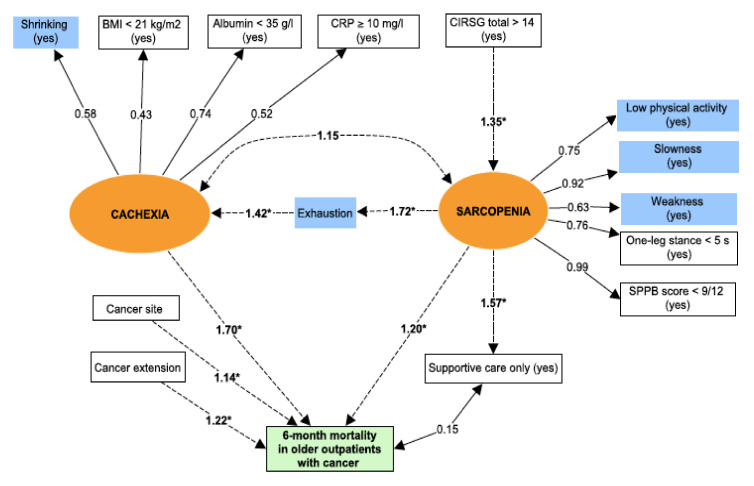
Figure 4.
The pathways of the frailty phenotype leading to mortality. Circles (orange) = latent variables; Rectangles = observed variables; Correlations: dotted lines; Regressions: solid lines; Covariance: * p value (for regressions) < 0.05; Blue rectangle = Frailty criteria; Green rectangle = Outcome. Latent variables represent non-observed variables but which summarize a set of directly observed variables. Latent variables are constructed by using strong correlations between observed variables. Regressions are then used to assess association between latent variables and outcomes.

