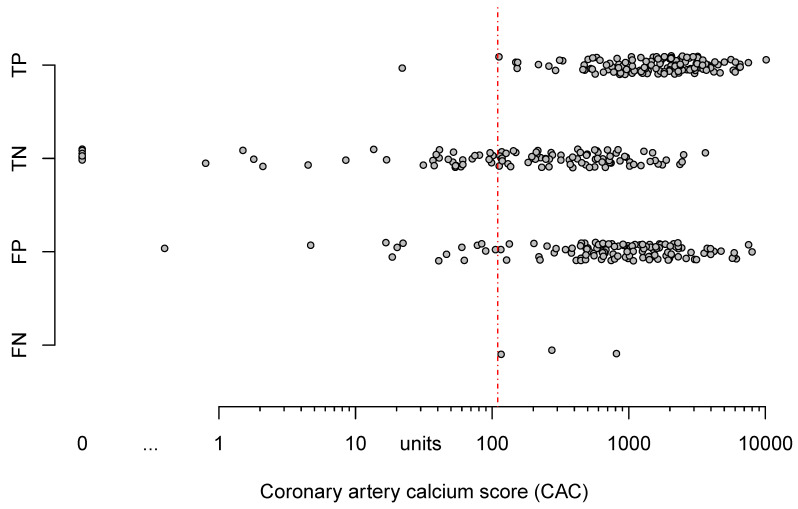
Figure 2.
Dot-plot of patient’s CAC and their classification according to cCTA against invasive coronary angiography with QCA. Note the vast overlap of true negative and false positive results in relationship to CAC. The threshold (red dashed line) drawn at a CAC of 110 would exclude all false negative results as well as most true negative results. CAC = coronary artery calcium score, FN = false negative, FP = false positive, TN = true negative, TP = true positive, QCA = quantitative coronary analysis.

