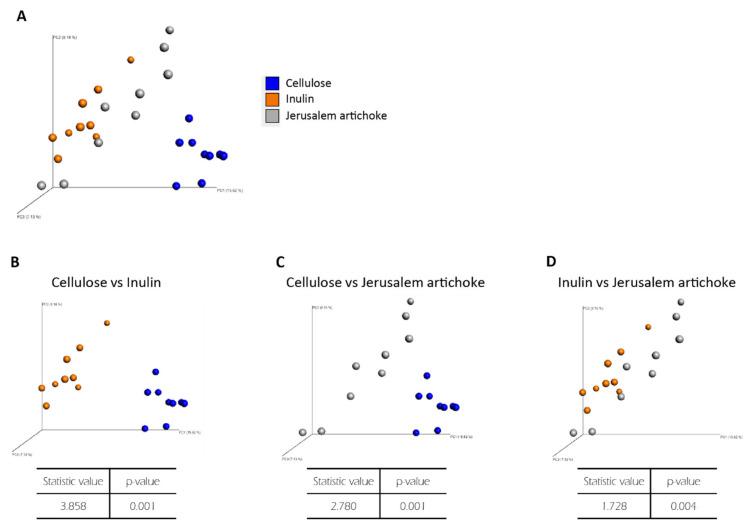
Figure 3.
The microbiota compositions differed across all experimental groups. Bacterial beta diversity index for comparing (A) each group, (B) cellulose and inulin, (C) cellulose and Jerusalem artichoke, or (D) inulin and Jerusalem artichoke. The principal coordinate analysis (PCoA) plots of unweighted UniFrac distance metrics obtained from sequencing the 16S rDNA gene in feces (cellulose (n = 9), inulin (n = 9), Jerusalem artichoke (n = 9)). The table in these figures indicate the result using PERMANOVA.

