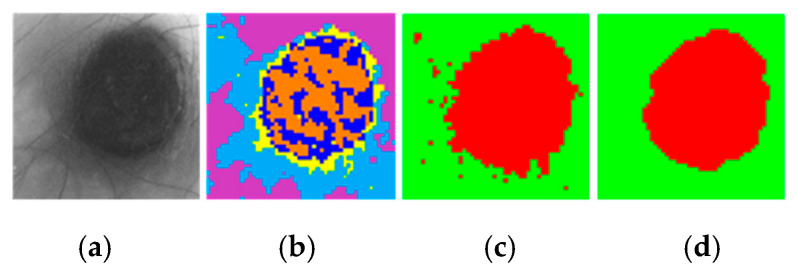
Figure 8.
HS dermatologic segmentation example. (a) Gray-scale image. (b) Segmentation map using five clusters (colors are randomly assigned). (c) Two-class segmentation map obtained after comparing the five centroids with the reference library using the SAM algorithm (red indicates PSL and green normal skin). (d) Two-class segmentation map after applying morphological closing operation.

