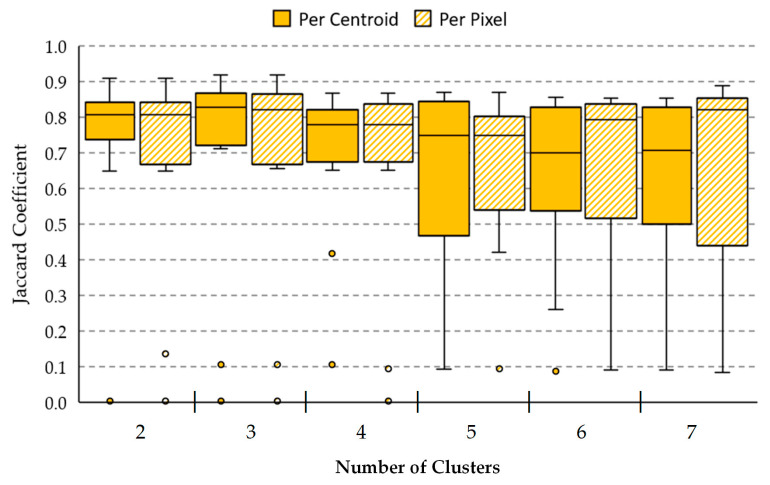
Figure 11.
Comparison between per centroid and per pixel methods using different number of clusters for the validation data using the Jaccard coefficient. The box boundaries represent the IQR of the results. Central bars and error bars depict median and minimum/maximum values of Jaccard coefficient, respectively. The small dots outside the minimum/maximum values represent the outliers of the Jaccard coefficient found in each method.

