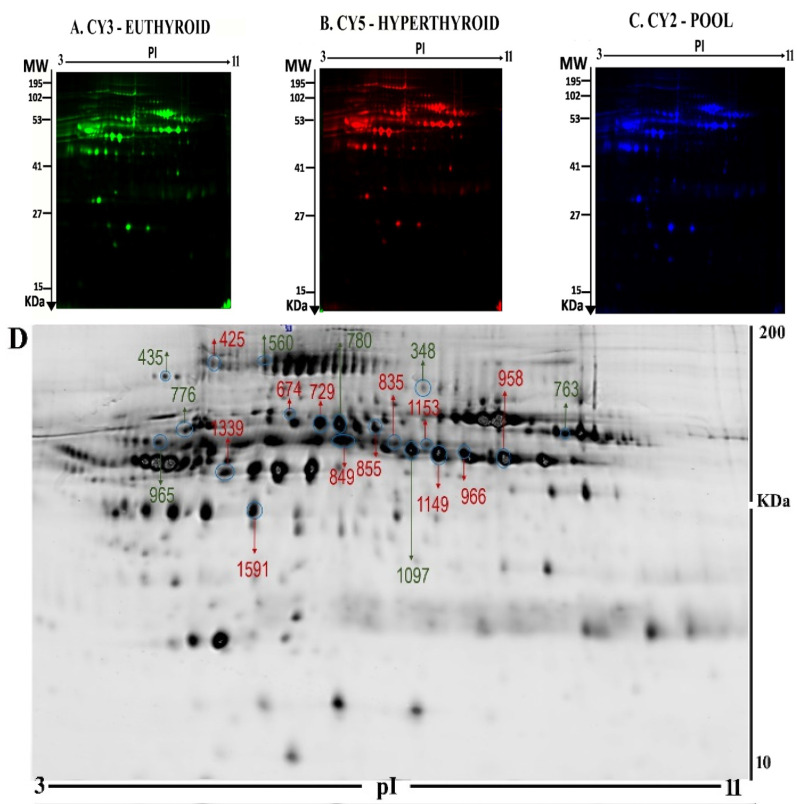
Figure 1.
Representative fluorescent protein profiles of a two-dimensional difference in gel electrophoresis (2D-DIGE) containing euthyroid samples labelled with Cy3 (A), hyperthyroid labelled with Cy5 (B), and pooled internal control labelled with Cy2 (C). 2D-DIGE numbered spots indicate those proteins that were identified to be differentially abundant (defined as fold-change > 1.5, p < 0.05) between the hyperthyroid and euthyroid states and successfully identified with matrix-assisted laser desorption/ionization time of flight (MALDI TOF) mass spectrometry (MS) (D). MW, protein molecular weight; pI, isoelectric point.

