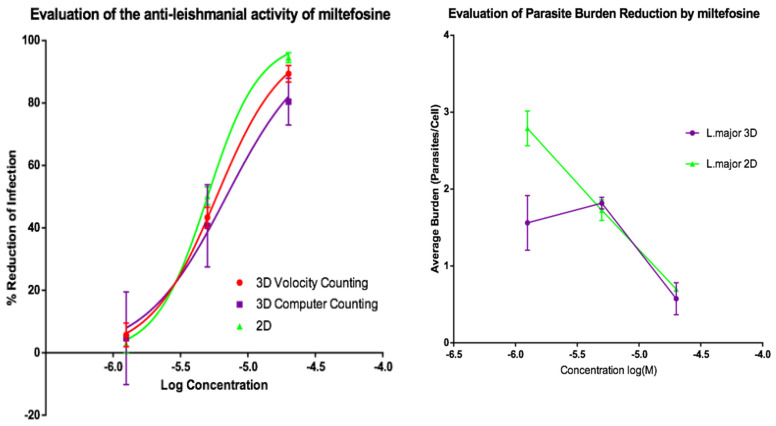
Figure 6.
(Left) Dose-response curves for 2D (n = 6) and 3D (n = 6) cell cultures showing the reduction in percentage infection of PEMs by L. major produced by treatment using miltefosine. The percentage reduction in infection calculated based on total infection seen in the untreated controls in either condition. (Right) Reduction in L. major parasite burden of PEMs for 2D (n = 6) and 3D (n = 6) cell culture, produced by dosing with miltefosine. Error bars show SD.

