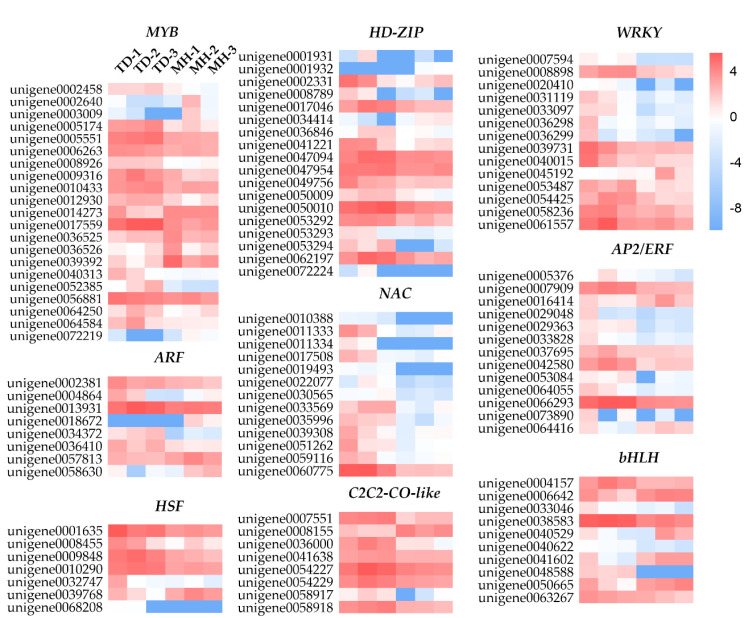
Figure 9.
Changes in expression of genes encoding members of several representative transcription factor families in Onobrychis viciifolia grown at high-altitude Tongde (TD) and low-altitude Minhe (MH). The heatmaps are constructed according to log2 (FC) of differentially expressed genes (TD/MH comparison). Up- and down-regulation are indicated by red and blue, respectively. The colored scale represents expression changes based on the log2 (FC) values of TD/MH comparison.

